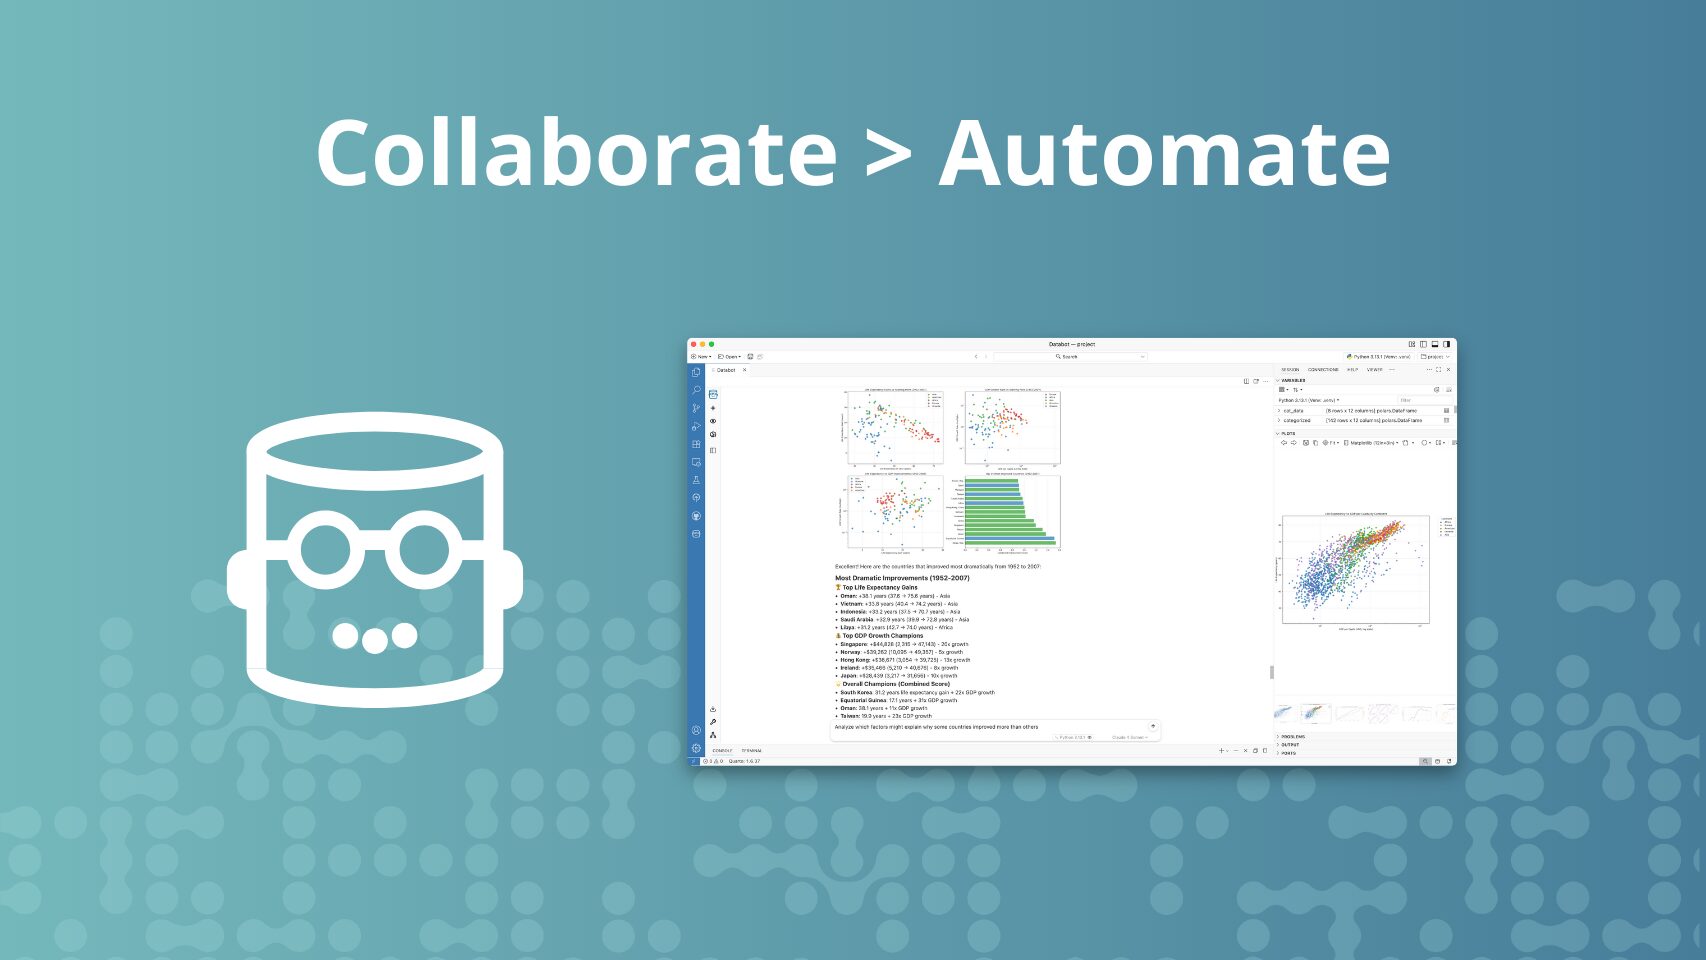
Introducing Databot: An AI assistant for exploratory data analysis
We’re excited to announce Databot, our most ambitious and direct application of LLMs to data exploration yet.
Databot is an AI assistant designed to dramatically accelerate exploratory data analysis for data scientists fluent in Python or R, allowing them to do in minutes what might usually take hours. It’s a complement to the data scientist, not a replacement.
We’ve carefully designed Databot based on our many years of experience creating tools for code-first data science. Compared to most existing AI-assisted analysis tools, we believe Databot’s approach leads to more reliable, serendipitous, and transparent insights.
Note that Databot is currently a research preview and only available for Positron.
Of all the ways Posit has explored LLMs, Databot may be the most useful—but also the most dangerous. We’ve written a separate blog post to explain why: Databot is not a flotation device.
What is exploratory data analysis?
Exploratory data analysis (EDA) is the initial process of understanding a new dataset. You can think of it as asking and answering a series of questions, like:
- What’s the structure of the data? What tables exist? What columns and data types do they have?
- Are there quality issues in the data? Are there missing values? Do the distributions and ranges seem reasonable?
- What relationships or patterns show up in the data? Is there a surprising correlation between variables—or perhaps a surprising lack of correlation? Are there unexpected clusters?
- What questions could we ask of this data? What hypotheses might be testable?
EDA lays the foundation for any data project. It’s how you form an initial understanding of the data. Through summarization and visualization, EDA helps reveal the structure, distributions, relationships, and anomalies that guide every downstream decision. Without it, we risk building models or conducting hypothesis tests on flawed assumptions—overlooking issues like outliers, missing data, unexpected correlations, or misaligned units of analysis.
This process of exploration often generates valuable insights in and of itself—patterns in subject behavior, shifts in operational metrics, or seasonal trends that weren’t previously understood.
How Databot works
Unlike many data-oriented AI agents today, Databot is not intended to investigate and answer data questions by working as autonomously as possible. Nor is it constrained to a web-based sandbox where the user is unable to effectively write their own code.
Instead, using Databot is a highly interactive experience. It’s a lot like pair programming with a data scientist who types incredibly quickly, never gets bored, and constantly has ideas for what to do next, but who still waits for your direction before proceeding.
At the core of the Databot experience is a loop, kicked off when the user presents Databot with a question or an instruction. This can be as broad as, “Are there any obvious data quality issues with this dataset?” or as specific as, “Set the x-axis minor ticks to 5-year increments.”
Databot then responds by carrying out the following steps (called the WEAR loop):
- Write code – Databot writes Python or R code to answer the question or carry out the task. This code is displayed to the user.
- Execute – The code is automatically executed in the current R or Python session. The output (including console output, plots, and tables) is visible both to the user and to Databot.
- Analyze – Databot makes observations and draws conclusions from the output. This might include answering the user’s question, or noting any surprising results, or calling out ideas for further investigation. After this step, Databot may choose to loop if there are really obvious next steps.
- Regroup – Databot proposes around three to five next steps for the user to choose from. This may include continuing the current line of inquiry, going on a side quest to explain some unexpected feature of the data, or asking an entirely new question.
The user can then choose one of the suggested responses or type in their own question or instruction. In either case, the process repeats.
Here it is in action:
The WEAR loop is optimized for exploratory data analysis, which thrives on structured serendipity—unexpected insights that emerge from systematic probing, visualization, and transformation. Databot accelerates this process dramatically, reducing the time and effort required to explore data, even for experienced analysts. But while Databot sets the stage for discovery, it’s still up to the human to recognize what matters and decide where to go next.
In practice, experienced data science practitioners can find this workflow exhilarating. It feels like you’re jumping from insight to insight as fast as you can think, without needing to wait for your fingers to catch up to your brain. But you’re always still in control, as Databot works in manageably-sized chunks before returning control back to you.
Using Databot
Now that we’ve explained how Databot works, let’s zoom out and talk about what a typical Databot session looks like.
Load and inspect data
Every data task starts with accessing the data. If you’ve already loaded some data into your current Positron session, Databot can use it. For example, here are some ways you can ask Databot to begin working with your data:
- “Look at df and df2.”
- “Tell me about the data I have loaded.”
If you haven’t loaded data yet, Databot can help you get started. This might mean reading in a CSV, connecting to a database, or setting up an API client. For example, you might ask Databot to:
- “Look in ~/Projects/2025/titanic/data/.”
Databot will list the contents of the directory, look for supporting documents like README.md or data_dictionary.txt, and identify data formats based on file extensions. - “Load all CSV data into a single data frame.”
Databot will do this and then use common Python/R functions likedf.describe()orglimpse(df)to learn the shape of the data. - “Connect to the SalesAnalyticsProd ODBC database.”
Databot can connect to databases using the same methods you already use from Python and R. If you want Databot to use a particular package, just tell it to. - “Load the most recent 10 Parquet files in S3 bucket s3://ds-prod-a1b2c3d4/daily.”
Again, if you already have the ability to connect to cloud object storage, Databot can do the same.
Once you’ve settled on a dataset, Databot will summarize the basic characteristics of the data: column names, data types, range, quartiles, etc. Databot will also notice if columns obviously represent years, country names, latitude/longitude, and other data of special significance, and use that knowledge to inform its analysis.
Quality checks
It’s typically a good idea to perform quality checks on your data, unless you’re sure someone upstream has done this for you.
Databot makes this easy. You might prompt:
- “Check for data quality issues.” This is surprisingly effective, just try it!
- “Look harder for data quality issues.”
- “Check for duplicate records.”
- “See if the missing data seems reasonable/expected.”
- “Verify that the categorical values all look correct.”
Explore
Now the fun part—the actual exploration!
When faced with a brand-new dataset, it can be difficult to know where to start. Databot helps by suggesting three to five steps at each turn. These might be follow-up questions, new areas of exploration, a closer look at outliers, etc.
For example, when pointed to passenger-level Titanic data, Databot suggested:
- Extract titles from passenger names and analyze survival by title
- Create a visualization showing survival rates by age, sex, and passenger class
- Analyze family size effects on survival (combining SibSp and Parch)
- Explore fare patterns and their relationship to survival
Of course, you don’t have to follow Databot’s suggestions. You can always just type in whatever next step you think makes sense.
Export
Databot lets you cover a lot of ground, incredibly quickly. But what happens to these insights when you’re done exploring?
Over the course of a Databot session, it’s likely that you’ll explore many different avenues, only a few of which end up being worth saving or sharing.
When you do want to preserve key insights, Databot’s /report and /notebook commands can help you extract them into a reproducible document. For example:
- “/report Include the survival rate breakdown by age group, family relationship, and class.”
Generates a reproducible Quarto document, containing both code chunks and Markdown narrative, based on the relevant parts of the current Databot session. - “/notebook Include survival rate analysis by gender and fare price, as well as the data quality analysis.”
Does the same thing as /report, but creates a Jupyter notebook instead.
As a Databot user, it’s now your job to carefully review the generated source code and outputs to ensure they do not contain mistakes or hallucinations. If you find any mistakes, you can either fix them directly or, if they invalidate downstream conclusions, you can resume the conversation with Databot by informing it of the mistakes.
Ready to try Databot?
Here’s what you’ll need to get started:
- Install Positron: Download the latest version here.
- Get an Anthropic API Key: Create an account and get your API key from Anthropic.
- Install Databot in Positron: Follow these instructions to enable and open Databot in Positron.
FAQ
- Who is Databot for?
Databot is currently intended for experienced R and Python users who are familiar with data analysis.
- Are you sure it’s not for people who aren’t comfortable writing their own code? Why not?
As far as we can tell, today’s models cannot be trusted to do open-ended data exploration without at least occasionally making mistakes. That’s why Databot’s user experience is intentionally code-forward, and a Databot analysis is not truly complete until the user has carefully reviewed important subsets of the model-generated code. Learn more here.
- How can I try Databot?
Follow the instructions here to install, enable, and open Databot in Positron.
- How is Databot different from Positron Assistant?
Positron Assistant is a coding assistant: it helps you write code or modify code on disk and can execute arbitrary code in Agent mode. Databot is a purpose-built exploratory data analysis agent. It writes and executes its own code on the fly to help you understand your data. It doesn’t care very much about the code you’ve already written.
- Can I use Databot for machine learning, Shiny apps, ETL pipelines, or other tasks?
Databot will attempt other data-oriented tasks if prompted, but it was primarily designed for exploratory data analysis. The user experience is aimed at rapid iteration of short code snippets that execute quickly, and assumes that insights, not code, is the primary goal.
- What data sources can Databot use? Will it work with databases? Parquet files on S3?
In theory, anything you can reasonably do from an R or Python console is possible in Databot, as long as Claude knows how to do it. For accessing data that isn’t on disk, you may need to provide a little more guidance to Databot to get started, like giving it a snippet of code that shows how you normally connect to your data source in Python.
- What LLMs can Databot use?
Databot is currently calibrated to work with Claude Sonnet 4. It also works well with Claude 3.5 Sonnet v2. Claude Opus performs similarly to Sonnet 4 but is more expensive, so we recommend Sonnet 4 in most cases. We do not recommend Claude 3.7 Sonnet because it tends to do far too much work before returning control to the user.
- Are OpenAI, Gemini, and other models supported?
Not at this time, though we hope to add support soon.
- Will Databot be available in RStudio?
We certainly intend to bring more AI capabilities to the RStudio IDE. Whether Databot specifically comes to RStudio depends on many factors, including the feedback we receive from users.