People analytics for getting to the moon
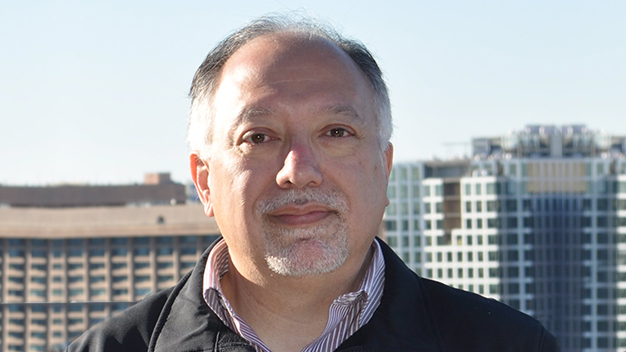
David Meza

Episode notes
We were joined by David Meza, AIML R&D Lead, People Analytics at NASA.
We had a great chat about people analytics for getting to the moon and beyond 🚀
Here are a few snippets:
What areas do you focus on in people analytics?
A lot of our focus is around natural language processing, graph algorithms, and graph databases. We create a knowledge graph & apply various algorithms to be able to deliver answers.
An example of this is around our skills and competency capabilities. Trying to get back to the moon and onto Mars, we need to identify the various skills and competencies that we have in our individuals. From a human perspective, that’s very labor intensive. We’re trying to use some of the concepts I’ve mentioned to be able to extract NASA-specific competencies from individuals or people applying for jobs to see how they align to our workforce.
- We’re starting to develop pipelines and methods to say:
- • We’ve got gaps here
- • Or here’s your career path
- • Here’s your training path
- • Here are the number of individuals we have that meet 70% of our skills and we need to upscale them to the next 30%
People analytics can be broken into so many different areas:
- • Attrition
- • Time to hire
- • Recruitment capabilities
- • Learning/ development
With regards to skills for people analytics:
- • NLP is a good tool to have because a lot of the data we have is unstructured. We need to be able to pull from that.
- • Understanding various classification models, how you’re grouping individuals & understanding various metrics within the HR area.
How much of people analytics is data science and predictive modelings versus reports and business intelligence?
Right now everybody does a little bit of everything
When I first got here, they were primarily focused on reporting and creating some type of visualization
Over the last couple of years, we’ve been trying to break into a group that focus on reports in general and a group looking more at the data analytics & modeling, creating the various algorithms that we can utilize for extracting skills and competencies or looking at our attrition models, for example.
Ideally, I would break it down to 5-6 visualizers, 10 data scientists and 4-5 data engineers or architects.
Resources shared:
Joe shard an example of Shiny at NASA: https://lnkd.in/gRJjFX6B
David shared Predictive HR Analytics: https://lnkd.in/gPPjjzPZ
David shared Inclusalytics: https://lnkd.in/g48tdrMu
Rachael shared the rstudio::conf workshop for admins: https://lnkd.in/eB9FZt-c
Rachael shared the RStudio workshop for people analytics: https://lnkd.in/e4DdhFAV
George shared an article on writing a resume for AI: https://lnkd.in/g3cF_vtD
Featured in this episode

