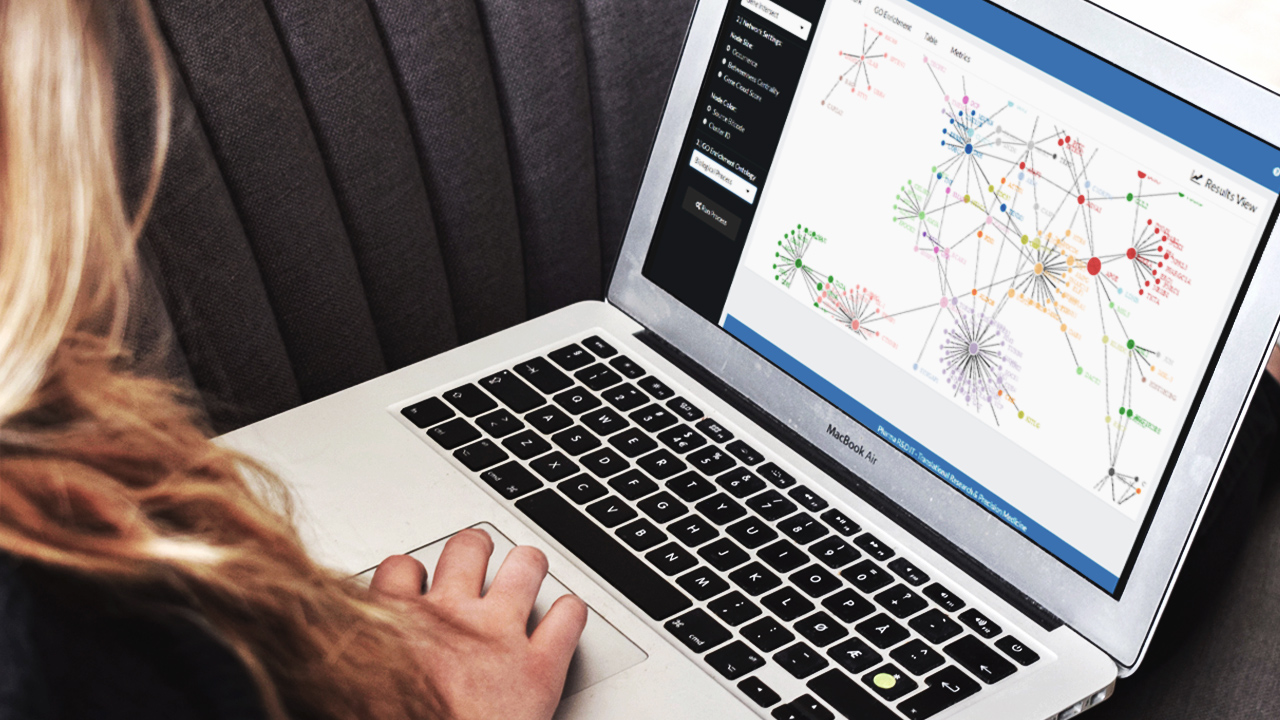
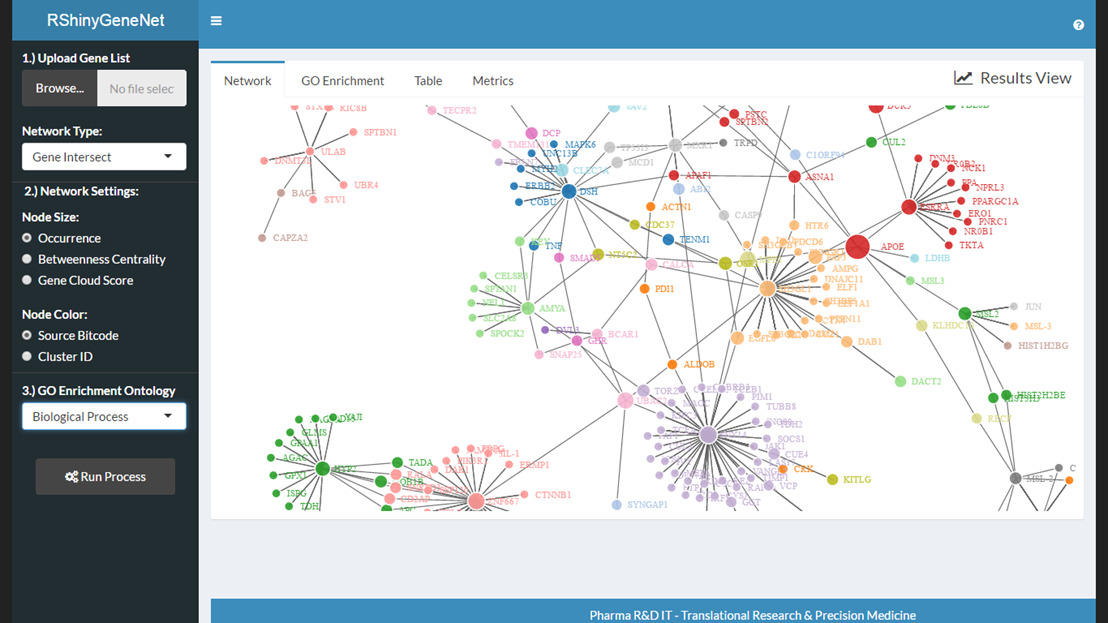
Janssen scientists are most efficient when they have the ability to easily share code and applications, and collaborate with colleagues. They are looking to conduct their analyses in R, develop Shiny applications to share with other scientists and business colleagues across J&J, and submit R batch jobs to an HPC cluster. Traditional RStudio Server and Shiny environments employ single-node setups, with a shared drive between them to store R packages and host Shiny apps. However, the team determined that this setup would not scale well with increasing demands for compute or memory.
Janssen’s R service for visualization and processing

"The Janssen Global Epidemiology department has built a tool using R and Shiny to conduct network meta-analyses using data from ClinicalTrials.gov.”
The Solution
The Emerging Technologies team specializes in High-Performance Computing (HPC) and Elastic Cloud Computing. They developed RSVP: The R Service for Visualization and Processing. Explained simply, it’s R as a service. RSVP is a robust R/Shiny computing environment for scientists throughout Janssen.
Johnson & Johnson leverages Amazon Web Services (AWS) and has a designated virtual private cloud team (VPCx) on-site. The Emerging Technologies team built an environment as a cluster containing a master node, any number of personal nodes, and a burstable computing grid for on-demand “embarrassingly parallel” computing power. Posit Connect and RStudio live on the master node. Once a user joins the environment and creates a folder to store their Shiny applications they then see an RStudio GUI and have the ability to run Shiny applications from their home folder.

Why Posit?
Posit Connect and RStudio Server provided the proper tooling for scientists and complemented the team’s background in clusters and Chef, allowing them to scale and make enhancements to their environment as needed. When an enhancement needs to be made, it requires minimal work to a Chef cookbook.
Before, Janssen scientists often had to use a second computer to perform their R analysis, since their work consumed too much computational power for a single laptop. For example, it took one scientist 2.5 days to run his analysis conducting feature selection and permutation testing markers predicting Alzheimer’s disease risk. The time to spin up RStudio and update his application has been reduced to a half-day!
