Winners of the 2024 Table Contest


We at Posit believe that using tables makes for a really great way to express your data. While we know they are indispensable for storing/transforming/summarizing data, they can also be used for reporting data… you just need the right table tools for the job!
In the past few years there has been a whirlwind of development for table-display packages on the R and Python sides. The collective work helps us to generate well-designed and informative presentation tables. The community has been instrumental in helping with these efforts and one of the important activities there is sharing examples and tutorials on how to effectively use these powerful display table APIs.
Evaluation
Submissions were evaluated based on technical merit and artistic achievement. We would like to thank all of this year’s judges, which are: Robin van den Brink (Product Manager at Polars), Greg Lin (Posit Software Engineer, maintainer of reactable, GitHub), Daniel Chen (Data Science Educator & Developer Relations at Posit, GitHub, Website, LinkedIn, X, Mastodon), Jack Davison (Previous winner, Website, X (Twitter), Fosstodon, GitHub, LinkedIn), Isabella Velásquez (Posit DevRel, website, LinkedIn, fosstodon), Josh Fangmeier (Previous winner, Website, GitHub, LinkedIn), Tom Mock (Product Manager at Posit website), Curtis Kephart (Posit community organizer, LinkedIn).
They put in quite a lot of time and effort when evaluating submissions and we totally appreciate that!
There were two types of submissions in this year’s contest:
- Single Table Example: These may highlight interesting structuring of content, useful and tricky features, or serve as an example of a common table popular in a specific field. All submissions included well-organized and documented code reproducing the table.
- Tutorial: These serve to teach us how to craft a display table, or they help us understand a package’s features. This format usually shows us several tables, often including interesting narrative.
We then placed each submission into one of the following categories:
- Interactive HTML: An HTML table, built with R, which has some interactivity.
- Interactive Shiny: Interactive tables built with Shiny.
- Static: These are tables that do not have interactive elements. These may be designed for print or they might be HTML.
That’s how we divided the submissions. It helped us organize the judging aspect of the contest and it will help us classify the submissions as they become enshrined in the Posit Community Table Gallery. It was really difficult to pick a single winner, but we tried our best and we hope we got it right.
Prizes - All winners and runners up receive a free year of shinyapps.io or Posit Cloud Premium. The top prize receives a considerable amount of swag. And all participants receive as many hex-shaped stickers as we're able to fit in an envelope.
The Winner
Today's Top Hits - Spotify Dashboard
interactive-HTML / tutorial - View the Table, Code
By Melissa Van Bussel - YouTube, GitHub, Website, LinkedIn
This submission is our winner for 2024 and it features an incredible table full o’ music nestled inside a Quarto Dashboard. There are so many incredible implementation and design details on display here; it’s obvious that a lot of thought and effort went toward bringing this application to life. And there’s more! We get a wealth of learning resources available through six (!) tutorial videos provided as part of this submission. That you get to listen to music (from the table!) is technically amazing and, more importantly, lots of fun. Truly this entry is music to our ears!
The Runners Up
Podcast Index Database Dashboard
interactive-HTML - View the Table, Code.
By Eric Nantz - Mastodon, Twitter, LinkedIn, Website, GitHub
There are so many podcasts out there and I guess that all makes sense since podcasts have been around since forever. While that’s great, the problem of duplicate podcast entries is present and this is now a (difficult) data science problem. This submission tackles that problem head on, solves it rather beautifully, and it has tables! It’s a wonderful thing.
Transfermarkt Contract Detector Shiny Application
interactive-Shiny - View the Table, Code.
By Ekrem Bayar - Twitter, LinkedIn, GitHub
Footballers get transferred all the time, it’s all part of the game. If you’re a football manager (or a pretend one) you’ll go mad trying to piece together all of the information on potentially transferable players, contract expiries, agents, etc. Better to put all that in a searchable table and that’s exactly what this submission expertly does. Tables solve problems!
Special Prize Categories
The Outstanding Novice Submission
Top AI Companies Stock Performance
View the Table, Code - static-HTML. By Arnav Chauhan Website.
AI is so hot right now. Should I buy some AI-based-company stocks? Which ones? Consult the table of this submission and you’ll feel you did your due diligence before plunking down the cash for shares.
The Best Static Table
Rolling Stone's Greatest Albums of All Time
View the Table, Code - static-HTML. By Sukalpo Saha GitHub, LinkedIn.
What’s Going On? What a great song/album and, according to Rolling Stone Magazine, it’s at the top of the greatest of all time. If you enjoy albums and their rankings, check out this table!
The Best Interactive Table
Top Ranked Board Games
View the Table, Code - interactive-HTML. By Richard Bamattre GitHub, LinkedIn.
Five thousand board games! That’s a lot, but I’m glad it’s all tabulated, ranked, and searchable. This table features very nice graphics and detailed descriptions of each board game. Such a wealth of information!
The Best Tutorial (feat. Tables)
Engaging tables with R or Python using {gt}
View the Tutorial - interactive-HTML / tutorial. By Albert Rapp Website, GitHub, LinkedIn.
I’ll likely never stop being impressed with the educational material that Albert Rapp produces. This is an incredible tutorial that teaches you how to make the same feature-rich table using {gt} (with R) and Great Tables (with Python). You can learn the basics of these packages through the high-quality videos or via the very detailed write-up.
The Best Single-Table Example
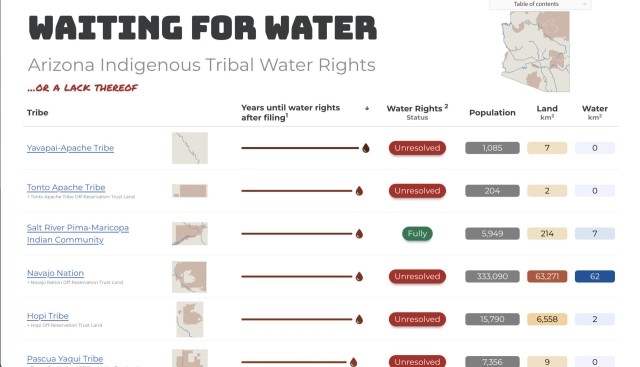
Arizona Indigenous Tribal Water Rights
View the Table, Code - tutorial / interactive-HTML. By Greg Chism Website, GitHub, LinkedIn.
This submission features a very impressive summary table which includes maps and even beautiful animations upon interacting with the table! Furthermore there is a very nicely written tutorial that teaches you how to generate the maps and the final table visualization. It’s great to see how the combination of diverse R packages can lead to a special table.
The Best Shiny Table
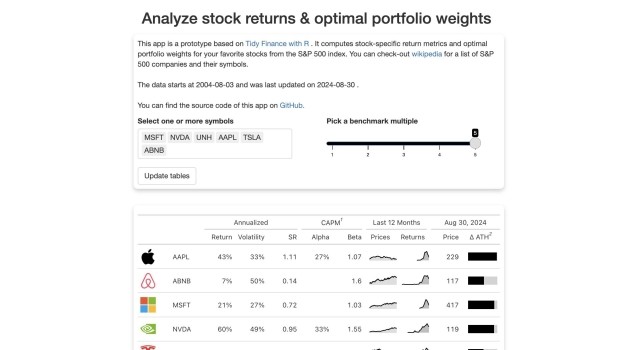
Stock-specific summaries and optimal portfolio weights
View the Table, Code - interactive-Shiny. By Christoph Scheuch Website, Website.
Management of stock portfolios is tough, but it doesn’t have to be! This submission uses Shiny and presents you with an optimal weighting of selected SP500 stocks in tabular form. Try it out, make the necessary trades, and sleep better at night!
The Best {reactable} Table
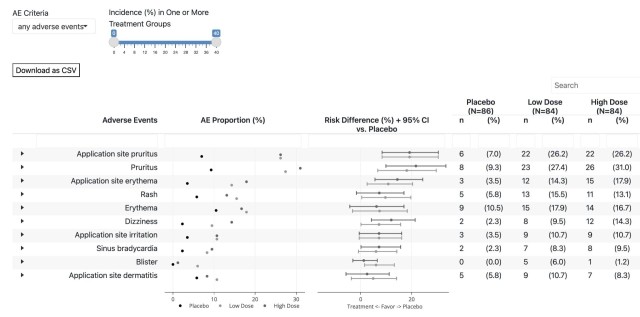
Create a Interactive Table for Adverse Events Analysis for Clinical Trials
View the Table, Code - interactive-HTML. By Bingjun Wang & Yujie Zhao Yujie's Website.
Forest plots have often been tricky to generate, especially within tables. This submission presents the authors’ {forestly} package, which solves the problem of making forest plots. The resulting plots are quite functional, beautiful, and of course useful. And there’s just enough information here to get yourself going acquainted with forest plot generation.
The Best {gt} Table
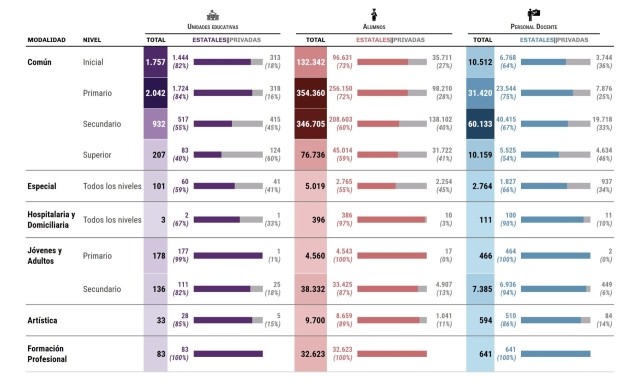
Resumen Sistema Educativo en Córdoba Capital
View the Table, Code - static-HTML. By Illak Zapata Website, GitHub, Twitter.
Making summary tables is one thing, but making a beautiful summary table is an art unto itself. I believe this submission has a summary table of the beautiful variety. Much attention has gone into the content as well as the aesthetics of the presentation. The tutorial breaks it all down so you too can learn the art of table making.
The Greatest Great Tables Table
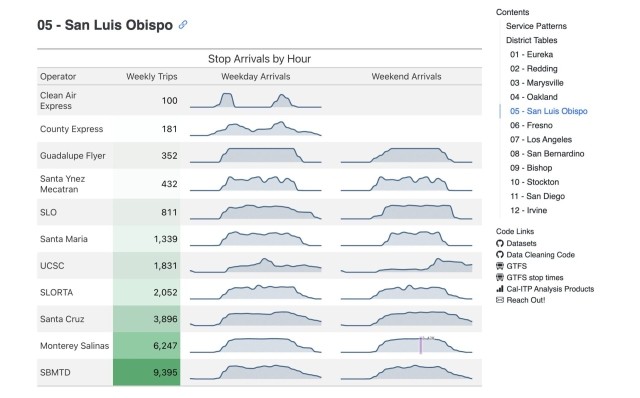
Hourly Transit Service Patterns
View the Table, Code - static-HTML. By Tiffany Ku GitHub.
With the power of Great Tables’ nanoplots, this submission successfully summarizes a huge amount of information with just a few tables. The format presented here allows for easy cross comparisons and makes it so easy to retrieve exact values (obtained from hovering over a nanoplot). This is what tables are all about!
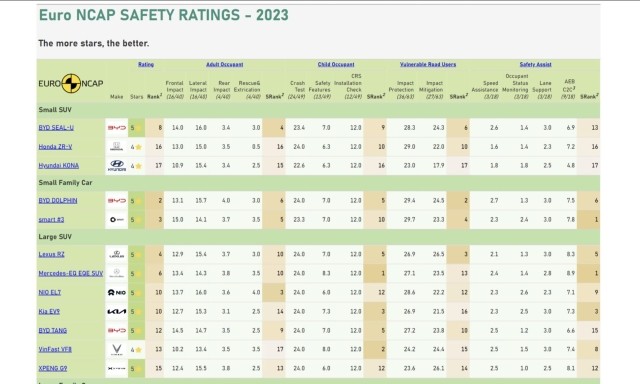
The Best Table that Uses Polars
Euro NCAP Safety Ratings - 2023
View the Table, Code - tutorial,static-HTML. By Jerry Wu GitHub, LinkedIn.
This comprehensive tutorial (and the resultant beautiful table) demonstrates how the Polars DataFrame library and Great Tables can work well together! You’ll learn how to craft functions and Polars column expressions to modularize the work. This tutorial shows how a clever table-building pipeline ties everything together.
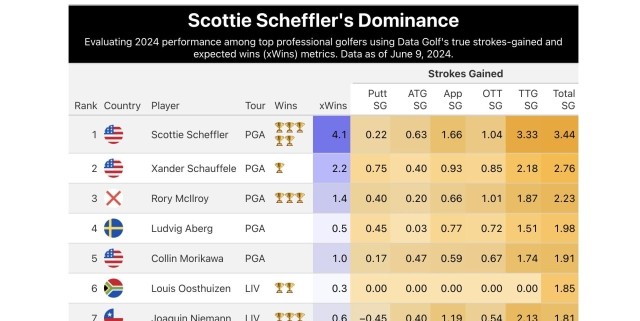
The Best Sports Table
Scottie Scheffler's Dominance
View the Table, Code - static-HTML. By Stephan Teodosescu Website, GitHub, Blog, LinkedIn.
This table uses features of the Great Tables package to generate an interesting table showing how Scottie Scheffler has truly dominated golf so far in 2024. We liked the use of flag and trophy icons to quickly convey where players are from and how many wins they racked up. That the statistical measures are colorized by value is quite inspired.
The Best Pharma Table
Complete Clinical Study Report Tables with gtsummary
View the Table, Code - static-HTML. By Agustin Calatroni & Daniel D. Sjoberg GitHub-Agustin, GitHub-Daniel.
The Pharma industry needs to produce tables for their own submissions. This wins in the Best Pharma Table category because it’s not just one table, it’s essentially all the tables. What the authors have done is reproduce all tables from the Clinical Study Report (CSR) of an open-source clinical trial using the {gtsummary} package. Now those in the know will find this to be amazing and it’s a testament to how capable {gtsummary} has become.
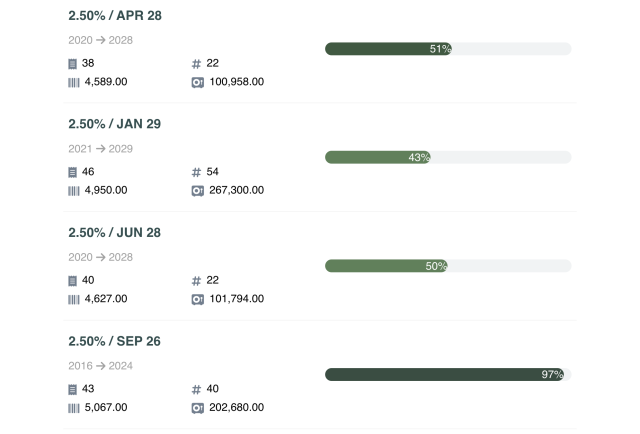
The Best Finance Table
Tables for Personal Finance (Ebenezer)
View the Table, Code - static-HTML. By Deepansh Khurana Website, GitHub, LinkedIn.
This submission shows us that financial instruments such as stocks and bonds can be beautifully encapsulated in table cells. These {reactable} tables contain beautiful typography and iconography, and these are qualities that tables made with {reactable} are known for!
The Special Prize for Going Viral with a Table
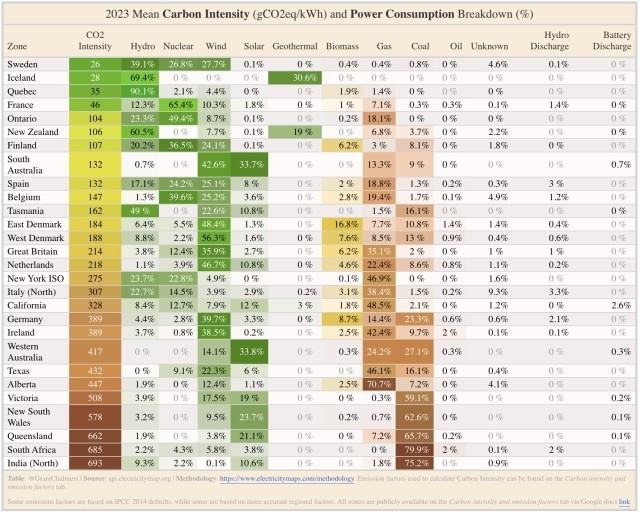
Carbon Intensity of Electricity Consumption
View the Table, Code - static-HTML. By Grant Chalmers Twitter, LinkedIn.
This table of carbon intensity through electricity consumption is nothing short of amazing. It makes what would otherwise be a foreboding wall of numbers a real treat to examine. Part of it is arranging the data and the other part is colorizing by value so that we can better scan and understand the display of data. This table (which is regularly updated with new data) is usually a hit on the socials. The comment section kinda blew up in its Reddit post, for example. Turns out that people are truly passionate about the data!
Honorable Mentions
The collection of table contest submissions was insanely good this year. Although everyone is not technically a ‘winner’, I find that everyone who submitted to the Contest is a winner in some way. Here in the Honorable Mentions category, we’re highlighting a cross-section of submissions that you really ought to check out.
- Africa Explorer - View the Table, Code - static-HTML. By Retselisitsoe Monyake Website.
- {emphatic} package - a tool for exploratory analysis of tabular data using colour highlighting - View the Table, Code - static-HTML. By Mike Cheng GitHub.
- felp::fuzzyhelp() for Fuzzy Search and Preview of R Documentation - View the Table, Code - static-HTML. By Atsushi Yasumoto Twitter.
- Indian Club Football Records - View the Table, Code - static-HTML. By Samrit Pramanik Website, Twitter, GitHub, LinkedIn
- Indian States Meteorological Data Table - View the Table, Code - static-HTML. By Jaspreet Singh Pabla.
- IPL Player Analysis - View the Table, Code - static-HTML. By Sreeram R LinkedIn.
- shiftR: Tidy Shift Tables in R - View the Table, Code - static-HTML. By Sukalpo Saha GitHub, LinkedIn.
- Table of Birds - View the Table, Code - static-HTML. By Shuhan Song Website and Tutorial.
- Tabulating Group Sequential Designs for Clinical Trials: Lucid, Structured, and Compact Summaries - View the Table, Code - static-HTML. By Yujie Zhao, Hiroaki Fukuda, John Blischak, and Keaven Anderson Website-Yujie, Website-John, Website-Keaven.
- Three.js Table with Country Geographic Information - View the Table, Code - static-HTML. By Anastasiia Kostiv GitHub.
- Titanic Challenge: Data Analysis to Predict Passenger Survival - View the Table, Code - static-HTML. By Francisco Alfaro Medina Portfolio Website.
- TSA Airport Checkings on Major Holidays - View the Code - static-HTML. By Joram Mutenge Website.
- Global and National Greenhouse Gas Emissions - View the Table, Code - static-HTML. By Jiddu Alexander Twitter.
- World Cup 2022 Recap - View the Table, Code - static-HTML. By Day Yi, Riley O'Hare, Luis Guaman, Sena Cetin, Lauren Pak, Vincent Etherton, and Jorge Hernandez Website.
Closing Remarks
We would like to make it crystal clear that it was a serious challenge to choose the winner, the runners up, the special prize recipients, and the honorable mentions this year. Those who didn't make this list still put in a lot of effort and did great work! The judges spent a great deal of time looking at all the tables, including all code and supporting narrative. Rich in particular experienced great consternation and some anguish when making the final deliberations. If you are ready to learn through example, we encourage you to check out all the submissions on the Posit forum tag for Table Contest 2024.
Thank you to everyone who participated: Nicolas Nguyen, Grant Chalmers, Abdulrahaman A Musa, Sukalpo Saha, Ekrem Bayar, Atsushi Yasumoto, Illak Zapata, Sukalpo Saha, Matheus Santos Rodrigues, Chris Gallo, Michael McCarthy, Sukalpo Saha, Agustin Calatroni, Daniel D. Sjoberg, Deepansh Khurana, Melissa Van Bussel, Matthew Currier, Christoph Scheuch, Jerry Wu, Francisco Alfaro Medina, Nicholas Vietto, Tiffany Ku, Mike Cheng, Richard Bamattre, Shuhan Song, Joram Mutenge, Jinhwan Kim, Diarmuid Lloyd, Filip Reierson, Janith Wanniarachchi, Day Yi, Riley O'Hare, Luis Guaman, Sena Cetin, Lauren Pak, Vincent Etherton, Jorge Hernandez, Colleen Minnihan, Anastasiia Kostiv, Greg Chism, Aaron T. Leese, Sreeram Ravindranathan, Jaspreet Singh Pabla, Samrit Pramanik, Jayachandra N, Arnav Chauhan, Bingjun Wang, Yujie Zhao, Yujie Zhao, Hiroaki Fukuda, John Blischak, Keaven Anderson, Jiddu Alexander, Albert Rapp, Matilde Sanches, Maite Saura Sanchez, Brenden Smith, Jeff Craggy, Gus Lipkin, Andres Felipe Quintero, Pierina Ponce, Eric Nantz, Nathan L. Brouwer, Gina Reynolds, Stephan Teodosescu, & Retselisitsoe Monyake

Rich Iannone

Michael Chow

Curtis Kephart
Related Content

What makes Posit different from proprietary analytics vendors

The Test Set 1 Year
