Building data pipelines in Python & R


Machine learning operations (MLOps) are a set of best practices for running machine learning models successfully in production environments. Data professionals and system administrators have numerous options for setting up their pipelines. However, while many tools exist for preparing data and training models, there is a lack of streamlined tooling for tasks like putting a model in production, maintaining the model, or monitoring performance.
In a blog post last year, we shared an example of how to update your machine-learning pipeline with vetiver and Quarto. While that example was R-centric, we’ve created a new one to show how Posit tools also support Python data pipelines.
As data science teams grow, people with different areas of expertise collaborate on the same project. The original creator of the process might be an R user, but the new maintainer is fluent in Python (or vice versa). Or, there may be a need to collaborate between R and Python developers in multilingual teams that want to run multilingual workflows.
Who is this example for?
- Python data scientists who want to build machine learning projects with existing interoperable data assets from R processes scheduled to run on Posit Connect.
- Multilingual data scientists who want to utilize both R and Python in their data science workflow. It can also be used as an example for multilingual data science teams collaborating with open-source tools like pins, vetiver, and Shiny.
What does the demo highlight?
Our Solutions Engineering team developed an app that provides real-time predictions of the number of bikes available at stations across Washington D.C.’s Capital Bikeshare program. There’s an end-to-end machine learning pipeline feeding data to the app. The pipeline uses R to import and process data, save it in a pin, create a model, then move the model to a deployable location.
We will walk through the updated pipeline below. To see the entire project, check out the GitHub Repo here.
Why is this important?
Many Posit Team customers deploy machine learning models using similar workflows to answer questions and provide value across their organization.
One customer using an end-to-end workflow includes the City of Reykjavík, who uses Posit Team to predict how crowded specific pools are at a specific time - among many other things!

Walking through an end-to-end data pipeline
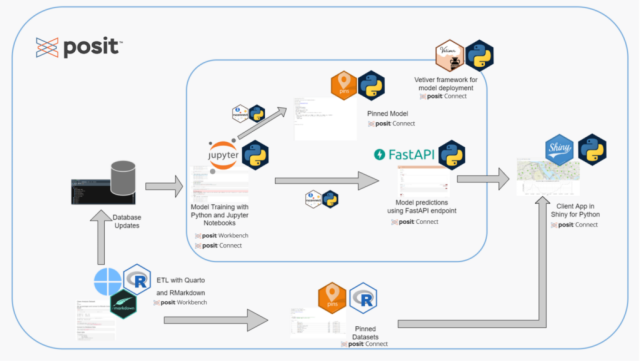
Run the ETL process in R
- Write the latest station status data from the Capital Bikeshare API to a database
- Join the status data with the station information dataset and tidy the data
- Automate the job by creating a Quarto notebook and scheduling the notebook to run periodically
Train and deploy a model in Python
- Pull tidied data in from a database
- Train the model using the data in Jupyter notebook
- Save the model to Connect as a pin, and then deploy to Connect as a FastAPI using vetiver
Create a Shiny for Python app serving real-time predictions
- Use the API endpoint to serve predictions to a Shiny app interactively
- Publish an interactive Shiny app that displays predictions of bike availability
Two of Posit’s professional products, Posit Workbench and Posit Connect, support the machine learning pipeline:
- Posit Workbench is the place for teams to collaboratively build open source data science projects at scale. It supports both R and Python, giving data scientists access to all the development environments they love, including RStudio, Jupyter and VS Code. Workbench provides enterprise-friendly features, such as centralized management, security, and commercial support.
- Data scientists use Posit Connect to automate time-consuming tasks with code, distribute custom-built tools and solutions across teams, and securely share insights with decision makers. Connect supports the work you create in both R and Python. Publish interactive applications, documents, notebooks, and dashboards. Deploy models as APIs, and configure reports to run on a custom schedule.
Building an end-to-end multilingual pipeline
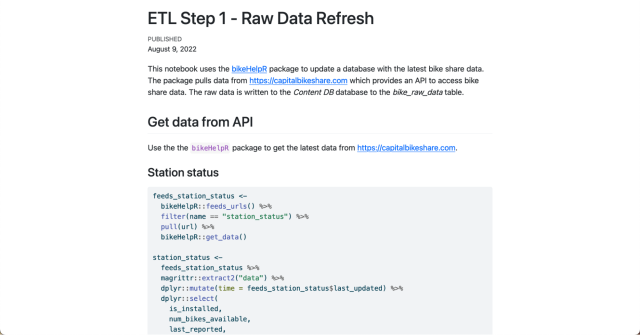
1. Extract, transform, load process in R
The first step pulls the latest data from the Capital Bikeshare API using the bikehelpR package. We write the raw data to the bike_raw_data table in a Postgres database.
2. Tidy and join datasets in R
We tidy the bike_raw_data table using tidyverse packages. Then, we join it with the bike_station_info table and write the output into the Content Database’s bike_model_data table. The R code is run as a scheduled Quarto document on Posit Connect to keep the database updated with the latest values from the source API.
We also create and update an R pin on Posit Connect, which holds the metadata about each bike station (like latitude and longitude, station name and address, etc.). This pin is updated weekly using a separately scheduled Quarto document.
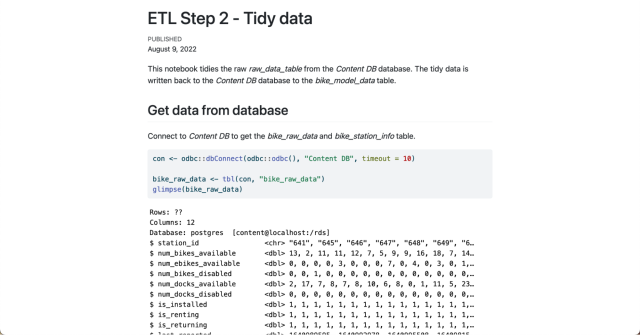
ETL Step 2 - Tidy Data Quarto Document
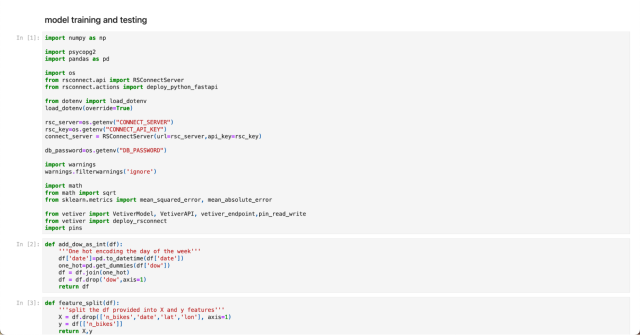
3. Train and deploy the model in Python
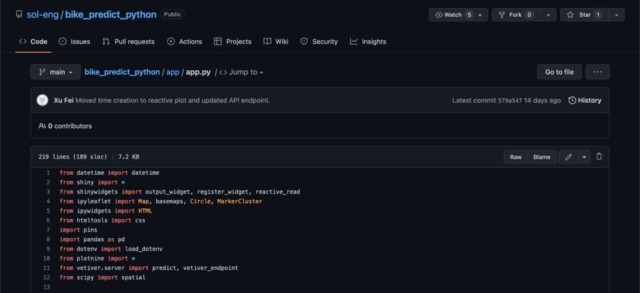
We use the bike_model_data table (updated using an R-based Quarto document) to train and evaluate a random forest model in Python. The model is saved to Posit Connect as a pin and then converted into an API endpoint using vetiver. Then, we deploy the API to Posit Connect.
4. Deploy a Shiny for Python app serving real-time predictions
Next, we use the API endpoint to serve predictions to a Shiny for Python app interactively. This Shiny app reads the station metadata pin from the ETL process above to populate station information in the map used in the application. It also uses the vetiver API’s endpoint to populate the number of bikes predicted for each station on the map.
5. Publish a Shiny for Python app on Posit Connect
Finally, we publish the app to Posit Connect so others can access and interact with it. We used Git-based deployment on Posit Workbench. This allows us to deploy content to Posit Connect directly from a remote Git repository.
Once on Posit Connect, we can schedule our notebook to run periodically (in this case, daily).
Machine learning with interoperable tools
With Posit products, colleagues using Python and R can collaborate, making your multilingual team more productive. We used various interoperable tools in this pipeline:
- We used R to clean the data, but thanks to the database connection, we could pull in the tidied data into Python.
- Pins are available in both R and Python.
- APIs can transfer data to and from different apps.
- Posit Connect publishes pins, APIs, and apps made with R and Python.
Thanks to these tools, data scientists who want to collaborate on machine learning projects with existing interoperable data assets can use both R and Python in their data science workflow.
Learn more about pipelines in R and Python
- You can find the source code for this pipeline in the GitHub Repository.
- Check out the Solutions website for the bike prediction app using R.
- We’d love to have you join us at one of our monthly Posit Team Demos, where we walk through a different end-to-end data science workflow each month. They are on the last Wednesday of every month at 11 am ET on YouTube. You can add the event to your calendar here: pos.it/team-demo
- If you have any questions and would like to talk with our team, you can schedule a time to chat here.

Isabella Velásquez
