New Posit platform insights with Chronicle


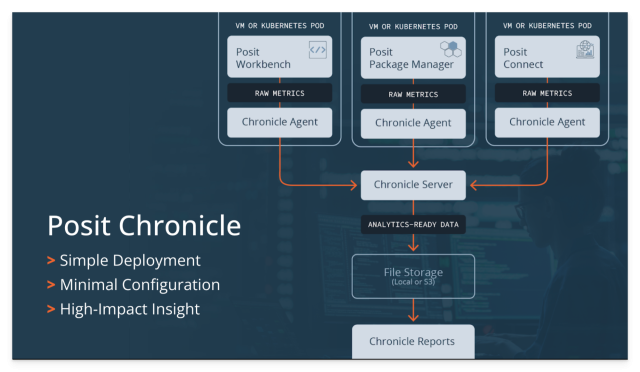
Posit Chronicle is an included visibility service designed to help data science managers and leaders understand their organization's use of Posit’s products, like Posit Connect and Posit Workbench. Turn usage metrics into actionable insights for proactive planning and growth that proves the value of your data science investment.
Centralized Metrics Collection
Chronicle takes the task of extracting and collecting usage metrics from each Posit product to a central location in a standardized, tabular format ready for further analysis or reporting. No longer do you have to write your own code for calling APIs and managing your data lifecycle.
Expanded Metrics for Deeper Insights
Chronicle extracts the most valuable usage data available from the Connect and Workbench APIs and metrics endpoints, including:
- User login and access history
- Connect content deployment and visits
- Workbench session metrics
- Server and environment inventory
Chronicle Metrics Cookbook
As a starting point for leveraging Chronicle data, we include the Chronicle Metrics Cookbook. This cookbook is more than just a documentation of all available metrics; it is generated based on your own data to provide a way to browse what usage metrics Chronicle has collected, along with visualizations where appropriate. It also provides code snippets that can be modified for custom reporting or joined with proprietary data for enhanced analysis.
These features, across unified user tracking, resource monitoring, and usage pattern analysis, are designed to transform your usage data into data-driven decisions.
For Data Analytics leaders, the value is great. You can use these insights to identify high-impact applications, justify investments, and strategically allocate your budget to the projects that are truly driving business value. Chronicle helps you realize the full value of your data science program.
Who has access to my usage data?
Your data remains yours. All data collected by Chronicle stays in your own environment (stored either on local disk or S3), under your own control. You choose what data gets shared and with whom.
Is there a cost involved? How do I get started?
Chronicle is a free, included capability available now to all Posit customers – no separate license is required. Installation is simple, and only requires deployment of a single, centralized metrics collection server, along with a small telemetry agent alongside each server running Connect or Workbench.
Next steps
Watch for these updates coming in late August! Once released, you can visit "Getting Started with Posit Chronicle" and "What’s New in Chronicle" to review detailed installation procedures and ensure you leverage these new capabilities effectively.

Joe Roberts
Related Content

MCP Servers on Connect: Managing credentials and access

Score a Disease Surveillance Model Inside Snowflake, Without Moving
