Manage your database connections from Posit Cloud


Data analysis is more fun with good data.
Thankfully, companies have spent years investing in systems where data is stored and updated more frequently than ever before.
Analysts and data scientists increasingly rely on these databases to efficiently extract relevant information, perform analysis, and automate workflows to put reports and applications into production.
Posit Cloud, our online platform to do and share data science in just a few clicks, now makes it simple for multiple people and projects to access external databases with Data Connections.
Data Connections in Posit Cloud rely on professional database drivers that simplify connecting to standard sources such as PostgreSQL, MySQL, and SQLServer and custom solutions such as Snowflake and Salesforce.
In this post, I walk through an example of managing your database connections from Posit Cloud. Watch the walkthrough and read more below:
A working example
Let’s test it out with a publicly available PostgreSQL database from RNAcentral that contains genetics data.
To get started, register for a free Posit Cloud account. On the left-hand side, create a new space. Then, click the Data tab from the top of the space.
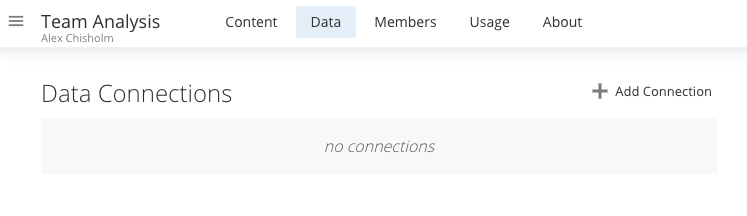
We’ll test the new feature with a publicly available PostgreSQL database from RNAcentral that contains genetics data.
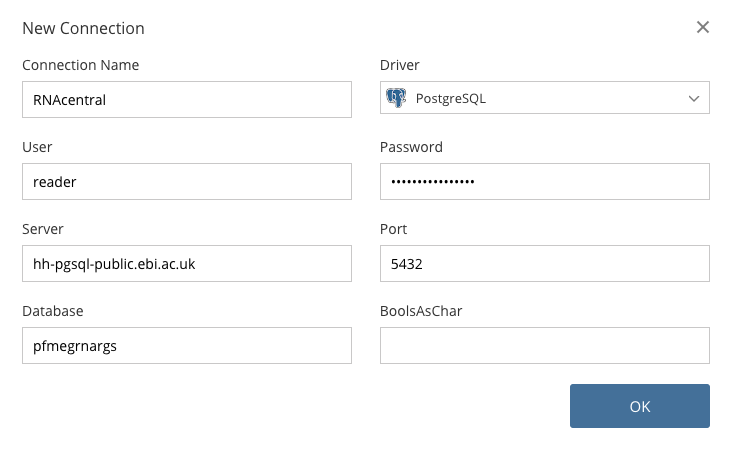
Add Connection prompts you to name a new connection and select the specific database driver for where your data is stored. Add the connection detail for RNAcentral (found in the link above), and Posit Cloud will securely store your credentials for use across any data project within a space.
The next step is to launch a new or existing RStudio IDE project in your space. Then, navigate to the Connections tab in your Environment pane.
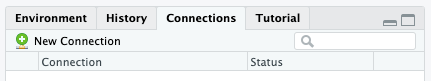
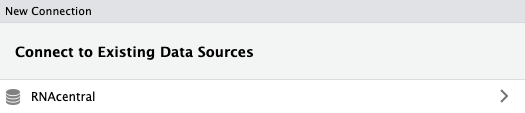
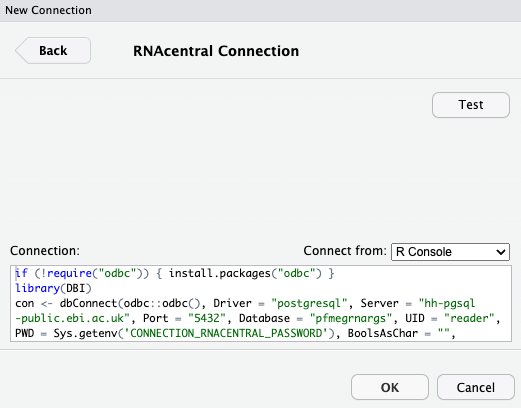
When you click New Connection in the Connections tab, you’re able to access the information you stored in the RNAcentral Data Connection.
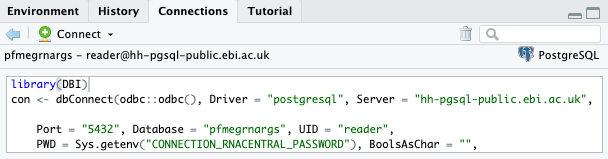
The generated connection string shows that your database password is stored as an environment variable named CONNECTION_RNACENTRAL_PASSWORD. You can run the code in the console to make the connection or include it in an R script where the password will not be stored.
Testing the credentials confirms if the connection information you stored is valid.
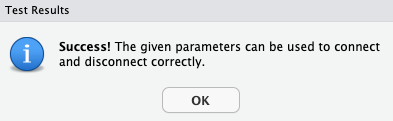
We look good to go.
After a live connection is made, the Connections tab now reveals the database schema and tables available.
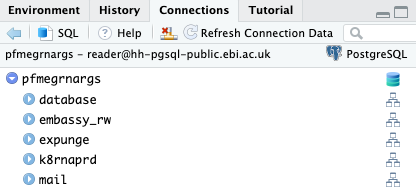
The schema rnacen has an important table named rna. We can use the dbplyr library to return the top 200 records.
library(DBI)
library(tidyverse)
library(dbplyr)

# note: if you choose to connect from an R Script this code snippet will automatically be added
con <- dbConnect(
  odbc::odbc(),
  Driver = "postgresql",
  Server = "hh-pgsql-public.ebi.ac.uk",
  Port = "5432",
  Database = "pfmegrnargs",
  UID = "reader",
  PWD = Sys.getenv('CONNECTION_RNACENTRAL_PASSWORD'),
  BoolsAsChar = "",
  timeout = 10
)

results <- tbl(con, in_schema("rnacen", "rna")) %>%
  head(200) %>%
  collect()
Digging into the results data frame reveals a numeric variable named len. From here, you can start exploring and quickly uncover the bimodal distribution of RNA length among these records.
ggplot(results, aes(x = len)) +
  geom_histogram(fill = "#447099", color = "black") +
  labs(title = "Distribution of RNA Length", y = NULL, x = NULL) +
  theme_minimal()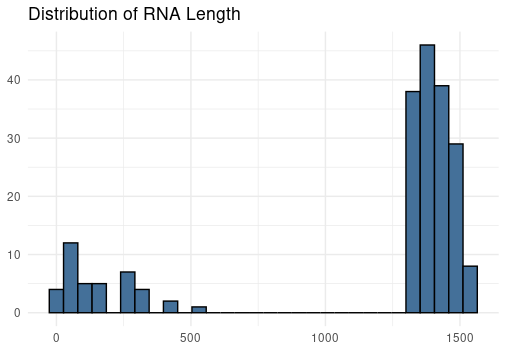
When you are done working with the database, you can close it via the Connections tab icon or by running dbDisconnect(con).
After disconnecting from the database, the connection remains stored for the next time you want to work with the dataset.
It’s as simple as that. Connect to your database. Do the work you need to do. Come back at any time.
Other benefits
Data Connections in Posit Cloud are shareable across new and existing projects within a space. You and your collaborators no longer need to set up the same database connections in each project.
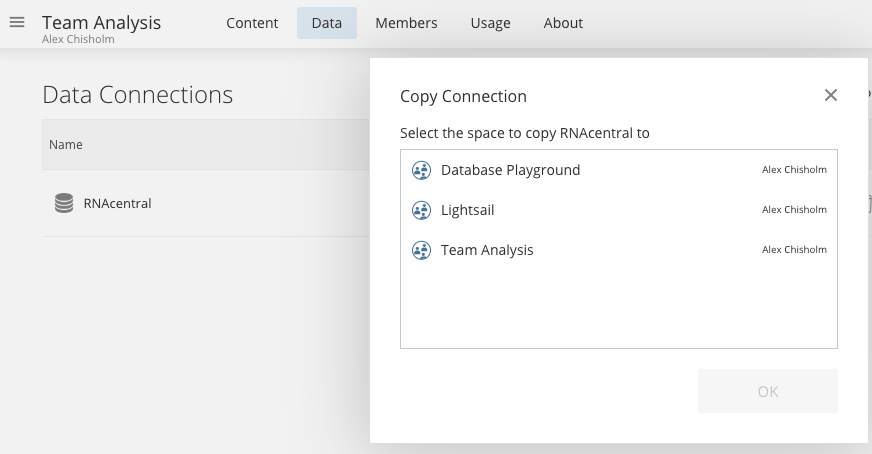
These connections can also be copied from one space to another from the Data Connections tab.
Finally, if your credentials change for a specific database, simply update the Data Connection. The connection details will automatically be changed when a project is reloaded or created.
You can sign up for a free Posit Cloud account and learn more about the data connections in our user guide.

Alex Chisholm
Related Content

MCP Servers on Connect: Managing credentials and access

Score a Disease Surveillance Model Inside Snowflake, Without Moving
