The path to ggpath

About the author
This is a guest post from Sebastian Carl, engineer and researcher. In his free time, Sebastian loves doing R programming and maintaining the #nflverse as well as other R packages. See more of his work on Linktree and keep in touch on Twitter and Mastodon.
In May 2022, I published {ggpath} on CRAN. It is an R package that extends {ggplot2} to place images in every part of a plot. Comparatively unspectacular, but for me, it was a milestone: the final point of a journey through the open-source R community, where I learned a lot and made a lot of friends.
This is the 2.5-year-long path to {ggpath}, a story that started with the need to plot images and ends with plotting images. In between are several R package releases – as illustrated in the figure above – and the formation of the #nflverse, a “universe” of R packages with fully automated data infrastructure, all open source.
But let’s go in order…
About me and how it started
I studied civil engineering in Munich, Germany, and decided to do a Ph.D. after a few years in industry. Coding in general and data handling in particular are not disciplines that the typical civil engineer learns in Germany. My research work mainly involved performing and evaluating large-scale experimental studies. Large amounts of data are collected during experimental studies, so at some point, one is forced to deal with the tools available to analyze the data.
In fact, I started data analysis with MATLAB, more or less the standard at our university. However, I was not satisfied with it for two reasons. First, it bothered me that I could only subset matrices with numerical indices, and second, I realized that if I wanted to continue after leaving the university, I would have to get a license.
One of my colleagues was already working with Python at that time and so I decided to switch from MATLAB to Python. I was a complete beginner and therefore worked mostly with NumPy for data manipulation and Matplotlib for visualization. The “license problem” with MATLAB was solved but the numerical indices still haunted me in NumPy at that time (yes, there was also pandas at that time but I didn’t know that at the beginning).
Around the same time, I started following by far the best German-language NFL analyst on Twitter, Adrian Franke. He analyzed the sport with film studies and “advanced stats”. On the latter, he shared tweets from Ben Baldwin. I think it was tweets like the one below that got me curious. They were a source of new ideas for me about visualizing data.
Small sample size because it's only been three weeks but throwing downfield to running backs: still not the best! pic.twitter.com/iMzHUpftW1
— Computer Cowboy (@benbbaldwin) September 25, 2019
So I followed the then relatively small NFL analytics community. I saw it as practice for my job duties and started getting involved with the data and visualizations. Ben also frequently published the code he used to generate the charts. The problem: it was written in this weird “R” syntax. There was this <- instead of = and then also the %>% at the end of many lines. I had just gotten used to the Python syntax and now this. I didn’t want to switch. But I had a problem. The NFL play-by-play data that everyone was working with at the time could only be obtained through the R package {nflscrapR}. There were people who provided the data via CSV, but that sometimes took days or weeks. So if I wanted up-to-date data, I had to get it myself using {nflscrapR}.
Fortunately, at the time Ben published a tutorial for getting started with R using the play-by-play data from {nflscrapR} as an example (this is actually outdated and has been ported to the {nflfastR} – more later – website but I keep the old link to show what I was using to learn R). That was indeed my introduction to R. Data manipulation with {dplyr}, plots with {ggplot2}, and the data from {nflscrapR}. I quickly realized that I really liked the initially unfamiliar (tidyverse) R syntax. The pipe makes the code very easy to read, NSE reduces the characters enormously and thus also contributes to the readability.
Seeing all those EPA/Play Charts by @benbbaldwin I was wondering about special teams because in the tight games especially in playoffs many TV experts point on their importance.
So I used some functions by @LeeSharpeNFL and of course Data by @nflscrapR and checked EPA/Play. pic.twitter.com/Z9OzVDYypJ— Sebastian (@mrcaseb) December 19, 2019
How a simple plot idea led to the development of {nflfastR}
After some time I wanted to publish a new chart. I wanted to insert the headshot of some players as an image in the plot, so something like this:
ESPN's QBR through Week 12 https://t.co/AsjYCD7gDa pic.twitter.com/ZglyPtP4VN
— Computer Cowboy (@benbbaldwin) November 26, 2019
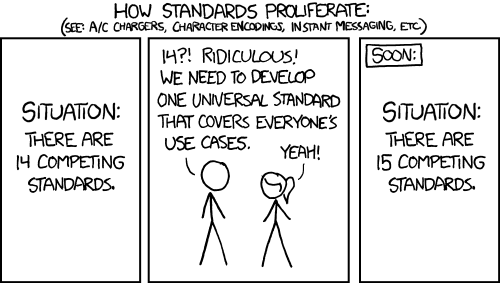
The problem: I needed the corresponding URL of the image. The NFL had the images as a static URL on their servers but you needed a player ID for the correct URL. The play-by-play data from nflscrapR contained player IDs, however, the NFL uses multiple ID types in the spirit of xkcd 927.
So I started looking. I really wanted to have those IDs so I could give something back to the community. It was just a small contribution, the URLs to the player headshots. After days of searching, I found the open API that NFL.com was running at the time. This API contained an endpoint for player rosters, which also had all the IDs for each player – including the ones I needed for the headshots. So I found the player IDs. But the API had other endpoints. One of them was called “pbp”. So there was also play-by-play data in this API! I wonder if there is more data there than in {nflscrapR}? So I played around with the pbp endpoint and it turned out that there were a few more variables than in {nflscrapR}, and the data went further back in time. While {nflscrapR} PBP data started in 2009, the data in this endpoint went back to 1999. Wow, more data! That had to get out into the community somehow.
The “raw” NFL play-by-play data is a nightmare for beginners in R. Deeply nested JSON data. And I wanted to have a “tidy” data structure out of it in the sense of the tidyverse. I couldn’t parse the data with {nflscrapR}, unfortunately, and I honestly don’t know why to this day. I didn’t care either, I just developed my own parser. This was a stroke of luck because it turned out that my parser was significantly faster than {nflscrapR}. While {nflscrapR} took about 20-25 seconds for 1 game, my parser did it in about 1-2 seconds. After a few weeks, I was done, had a working parser for the new pbp data, and tweeted about it.
I think this is the perfect thread to announce I am ready now for testing a new pbp scraping function with a significant speed boost (see image below). pic.twitter.com/StfVdrV9Kz
— Sebastian (@mrcaseb) April 8, 2020
The above-mentioned Ben Baldwin contacted me because he wanted the fast parser for a website that provided live advanced stats.
Ben and I worked together on the code and decided that we should release it in a separate package, named {nflfastR}. The most important features were the additional 10 years of data, more advanced stats variables, and significantly faster code due to the faster parser and parallel processing. So somehow, “I need these player IDs for an unnecessary headshot chart” turned into a new R package for NFL play-by-play data. I could probably write another dozen paragraphs with stories about the development of {nflfastR} but that would definitely go beyond the scope of this post.
Now I know how to develop a package
{nflfastR} was my first R package. I had absolutely no idea how to develop such a package and probably made every beginner mistake there is. Eventually, however, I mostly understood it. And after {nflfastR} was released, I turned my attention to other problems. I found myself writing my own functions in separate scripts and then loading them. That was going to end and I developed my personal R package with all my functions and other data. I recommended this approach to everyone who asked me, but the answer was always “I don’t know how to program an R package”. So I developed {personalr}, a package that helps to implement a personal R package.
🚨🚨 Introducing {personalr} 🚨🚨
An #rstats package 📦 for automated personal package setup.
Setup your own personal package that attaches your favorite packages and helper functions.
More information at https://t.co/sih9UufBn7 pic.twitter.com/Iaur8DeqaJ— Sebastian (@mrcaseb) November 3, 2020
How to simulate NFL seasons
At some point in an NFL season, everyone is only interested in who will make it to the playoffs and who they will have to play against there. That’s why season simulations are very popular. The problem: an NFL season is very short. In the past, the regular season was over after 16 games. Today it’s 17, so it’s inevitable that teams have an identical win percentage. For this case, the NFL has come up with tiebreakers, some of which are quite absurd. Seeding – the allocation of playoff seeds – is therefore not trivial to program.
Lee Sharpe made the effort to code the tiebreaker to a certain depth. And in early 2021, he decided to release his code. Together we worked on making the code “package ready”, and that’s how {nflseedR} was born.
I'm alive. ALIVE! https://t.co/HGeAQNjlgT pic.twitter.com/g0cXaUWwct
— nflseedR (@nflseedR) February 22, 2021
At first, we just wanted to work through the whole seeding process. But then we realized that we could also implement a simulator in the package that would be able to use a user-supplied model to simulate the results. Today, this package is very popular and is also used by professionals in the industry.
Time to put it all together
At this point there were the R packages {nflfastR} and {nflseedR}, as well as numerous other GitHub repos offering data such as play-by-play, rosters, schedules and more. These repos were distributed among different owners and contributors. Quite a mess. Fortunately, Tan Ho decided at that time to want to contribute to these open source projects. It was his idea to combine all the repos in the nflverse. And it was obvious to implement an R package as the tidyverse equivalent, the {nflverse}.
PSA: the various NFL packages created by @benbbaldwin, @mrcaseb, @LeeSharpeNFL, and @_TanHo have been consolidated into one "umbrella" organization:https://t.co/4JQjaZo8Ir
And the "nflfastR discord" is now the "nflverse discord" https://t.co/1ikOye0sAG— nflfastR (@nflfastR) June 3, 2021
But the nflverse is much more than just a collection of open-source packages. It is a large, fully automated data infrastructure using GitHub Actions. Tan gave a talk at RStudio Conference describing the general approach for such a setup.
Lightweight, we need a lightweight!
The data infrastructure became better and better and the data became more and more diverse. It was no longer necessary to use a package like {nflfastR} because its output was available for download. A major weakness of {nflfastR} was and is that it has 48 (reverse) dependencies. Therefore we wanted a new package, a package with few dependencies, which is basically responsible for reading the data from the nflverse. It was time for {nflreadr}.
📢📢 ANNOUNCEMENT ❗
Very excited to announce that the nflverse team has released nflreadr on CRAN. nflreadr is a package to facilitate easily downloading data from a bunch of different sources (so you don't have to remember urls).https://t.co/DaLduKXqHN pic.twitter.com/CFly0Mri84— nflfastR (@nflfastR) August 9, 2021
Back to the roots – let’s make plotting easier
There was now a whole lot of data to work with and create data visualizations. And that’s what I did for fun. The visualizations often work with team logos, team colors, and player headshots (remember how it all started?).
For this purpose, you had to join image URLs and team colors to the data every time. Also, there were often difficulties with image aspect ratios and the need for color changes or image transparency … this has to go in a package! I fell down the rabbit hole called ‘{ggplot2} internals’ and came up with {nflplotR}.
** ❗ NEW from #nflverse ❗ **
Have you ever wanted to do the following?
–> Transparent logos
–> Black & white logos
–> Logos in axis labels
INTRODUCING: nflplotR by @mrcaseb, an R package for easily making these plots
📊 https://t.co/GbTcC8laAb pic.twitter.com/rQCo16uNZY— nflfastR (@nflfastR) September 30, 2021
The first thing that {nflplotR} was able to do was to replace team names and player IDs with team logos and the player headshots and the requirements listed above, such as image transparency. Custom color scales for NFL team names were also included from the beginning.
Later, I realized that I could use the code independently of any NFL themes with geom whose main argument is the main argument of magick::image_read(), the path to an image. I named it geom_from_path().
My absolute favorite feature in {nflplotR} came after that. I really wanted a simple and performant solution for images in parts of a chart that could not be served by a geom, e.g. in the caption, as axis text or title, or in the plot title. For this, you have to code a theme element in {ggplot2}. And that’s exactly what I did.
This shouldn’t be NFL exclusive
It wasn’t long before other developers wanted to adapt nflplotR for other sports leagues. So it was time to detach the core from nflplotR and release it as a standalone package. The essential elements were geom_from_path() and element_path(), so the name {ggpath} was obvious.
🚨🚨🚨 New R package 🚨🚨🚨
Excited to announce the initial release of my new #rstats 📦 {ggpath}.
A ggplot2 extension that enables robust image rendering in panels and theme elements.
install.packages("ggpath")
More at https://t.co/aEMi4DYInv pic.twitter.com/BlxX5bmaEd— Sebastian (@mrcaseb) September 6, 2022
The nice thing about this package is that you can use it not only as a robust image rendering extension for {ggplot2} in general, but also as a core for {nflplotR} pendants. For this purpose, I have developed the package {nbaplotR}, which serves as a demonstration of how to use {ggpath} internally.
Summary
This is the “short” recap of my 2.5-year-long story in the open-source R community. It started with the simple – actually unnecessary – idea to plot NFL player headshots. I learned about R, the tidyverse (without the tidyverse as a blueprint, virtually none of this would have been doable), package development, and open-source collaboration via GitHub. I learned more than I ever thought possible and I made friends online and got to be part of a strong community. Why this story is about {ggpath}? It reflects a 2.5-year learning curve and at the same time it does what got me into the community in the first place, it plots images 😊
Related Content

What makes Posit different from proprietary analytics vendors

Deploying boosted tree models with Orbital
