Professional development for data teams
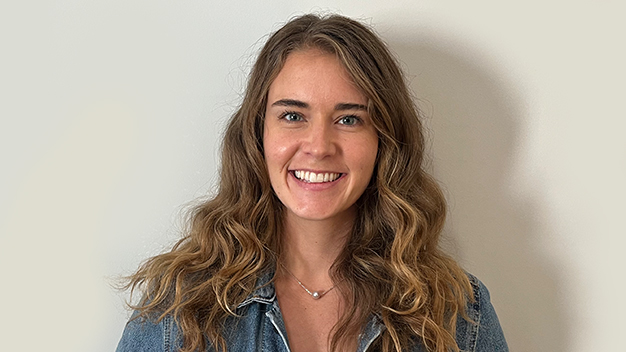
Namrata Shetty-Anderson

Episode notes
We were joined by Namrata Shetty-Anderson, Advanced Analytics Manager at The UPS Store.
Right from the beginning of the conversation with Namrata, we dove into the art of data storytelling (7:20)
…In my mind, data science is as much a science as it is an art.
To be able to tell your story, you could write hundreds of lines of code and you could build amazing models, but at the end of the day if you can’t translate it to a non-data person as a data story, all that is a waste. You’re not adding any value.
Businesses don’t care about your code. My boss doesn’t care about my hundreds of lines of code. He wants value.
So I call it the art of data stories.
I actually took a course by Kevin Hartman from Google, which talks about this. One thing I learned from that course is that you want to start with a solution for the problem in a tool agnostic environment.
Don’t start with your tool when the problem is posed in front of you because what happens is the tool is going to limit your ability to tell your story. If I say I’m going to use Power BI, then I’m going to be limited to the visuals that are available in Power BI.
So what I started doing, literally, was use a blank page and a pen.
What do I want my outcome to look like?
Once I know what that story is going to look like on a blank sheet of paper, then I decide what tool I’m going to use.
Now the tool is going to depend on a few things: How quickly do I need to turn this around? How complex is this task? How good am I with this tool?
Those are the things you need to look at. People say, Python’s better than R, R is better than Python. No, Power BI is the way to go. Tableau is the way to go.
No, everybody’s right and everybody is wrong. Your tool of choice will depend on the problem you’re trying to solve.
Don’t fall in love with anything you’re doing. Today you’re doing it one way, you’re going to find a better way to do it as you keep learning.
*The course mentioned above was Business Analytics, Communicating With Data by Kevin Hartman
Namrata also shared thoughts on approaches to professional development and skill building – (22:58)
Managing a data science team is different from managing a team that’s operations driven, product driven, or even a software engineering team.
It’s different because problems that come to a data science team are not always well defined and the solution is not cookie cutter. There’s no right answer, there’s no wrong answer.
You need a research oriented approach to what we do and a drive to keep learning.
So here’s what we have been doing.
- My whole team has the option of picking their learning platform.
Some pick Coursera, some pick a virtual summit or buy a book, whatever. You tell me what your best learning approach is and you can have it.
- The team is also encouraged to block off time on your calendar.
X hours a week or X hours a month, whatever you like to focus on learning and put it on your calendar. No one’s going to bother you. Do we do it? Sometimes. They’ll block it off and sometimes won’t do it. It happens to the best of us.
- We have a week long group camp
Every year we have kind of a week long group camp, as I call it, where we bring in a certified instructor (we’ve been focusing on R for the last two years at least) and just work on little projects with the team. For this week, the team is not bothered by anyone just to focus on learning. (more on how they block that time at 31:51)
- We started having monthly sessions.
We started with best practice sessions where one of the team members would say, hey look, this is a project I worked on and here’s how I approach the problem. This helps someone that’s new on the team, someone that’s learning to get some exposure to it.
You can learn everything online, you can learn from instructors but then when you have to apply it in the real world, it’s not a one to one translation. Real world data is not normally distributed. Real world data has noise in it.
When we maxed out our best practice sessions, we started doing a micro assignment. My team member Liz puts together micro assignments for the team with real work data – like online reviews, customer data, sales data – and perform these operations in R.
- We put together a central repository
Because my team does so many things, we have a repository where we have reference guides, best practices, and a lot of documentation. If someone new joins my team, I tell them you’re going to spend your first week just reading everything that’s on that repository.
Documentation, process documentation plays a very important role and it allows us to cover for each other. We want to rely on processes that make our people’s lives easier.
Featured in this episode

Some play video games, I play with data. Data fascinates me and telling stories with data exhilarates me! I am always looking for opportunities to share data stories to add business value and get better at what I do. I strive every day to find ways to support and empower data-driven decisions.

