How to learn R as a SAS user

SAS and R are popular programming languages used for statistical analysis. SAS has been used for years and is part of the legacy software stack for many organizations. However, open source offers innovative reporting and automation options and opens the door to powerful tools like Shiny.
Many pharmaceutical organizations are now using open source for drug development, and banks are using open source for machine learning and AI. Moreover, R is widely used in university settings and is often the first choice for many recent graduates.
Thankfully, there are many resources available to aspiring SAS to R programmers or those looking to add R to their analytical toolbox. While SAS and R are both statistical programming languages, they do differ in syntax, compute resources, data structures, data manipulation, visualization, control structures, functions, and more.
While translation guides and pre-built tools can be useful, they are insufficient for programmers who wish to harness the full power of R. We believe it’s worth embracing the learning process and learning R from the ground up. This will allow you to fully explore and take advantage of R’s potential.
So, don’t be afraid to jump in and start learning R while still using your SAS knowledge to aid in the transition. With time and practice, you’ll become proficient in both and enhance your data analysis skills.
This post is inspired by Shannon Hagerty, Nichole Monhait, and Phil Bowsher’s Introduction to the Foundation of the R Workflow, which follows the outline from The Little Book of SAS. Let’s begin!
A SAS programmer’s first steps in R
1. Getting started with R
SAS and R use different software. Our recommended first step: get to know where you’ll be working, RStudio!
RStudio is an integrated development environment (IDE) designed to support multiple languages, including R and Python. It includes a console, syntax-highlighting editor that supports direct code execution, and a variety of robust tools for plotting, viewing history, debugging, and managing your workspace. RStudio is free and open source, and Posit provides a commercial version within Posit Workbench.
To get started, either (1) download R and install RStudio on your computer or (2) access Posit Cloud to use the IDE in your browser. We’ve created a Posit Cloud project where you can start familiarizing yourself with the tool (you will need to register for a free account to access the project).
When you start RStudio, you’ll see four key regions or “panes” in the interface: the Source pane, the Console pane, the Environment pane, and the Output Pane.

- Source: This is where you write your code or computational documents. Your code will not be evaluated until you “run” it to the Console.
- Environment/History: This is where you can view the objects in your working space (Environment) or your command history (History).
- Console: This is where the code from Source is evaluated by R. You can also use the console to perform quick, interactive calculations you don’t need to save.
- Output: This is where you can see your file directories, packages, help files, and output (tables, plots, or rendered HTML).
We recommend walking through the RStudio User Guide to learn more about the IDE. Start playing around in your new work environment!
Wait, where is the log? When you run your first R code, you may wonder where the log is. R doesn’t have a built-in log. However, the open-source community has created packages (packaged bundles of functions, data, and code) that provide you logs in R.
- tidylog: a logging package that provides feedback about dplyr and tidyr operations
- logrx: a logging package created specifically in the pharma industry
In the example project, we’ve installed tidylog for you. Run the data manipulation steps to see the log populate in the Console pane:
2. Getting your data into R
Now that you are familiar with your working environment, it’s time to get your data into R (we will refer to this as reading or importing data).
Flat files
You have many options for reading/importing flat files with R, two of which are:
- The readr package from the tidyverse family of packages provides a programmatic way to read rectangular data from delimited files (e.g., CSVs, TXTs).
- RStudio’s data import tool is a point-and-click interface that lets you read data into R. Because Posit believes in code-first data science, the tool provides the corresponding R code for reading the data. We recommend copying the code into your R script so that you can reproduce your analysis.
- Click the Import Dataset dropdown menu near the top of the Environment pane.
- Choose the From Text (readr) option from the dropdown menu.
- Click Browse and use the new window to find and select the file you want to import.
- Make adjustments to the dataset if needed. For example, you may want a column read as numeric values to be imported as character values.
- Click the clipboard icon to copy the code displayed in the Code Preview window, then click the Cancel button.
You will see that your data is now available in the Environment pane.
SAS files
The haven package enables R users to read and write various data formats used by other statistical packages. With haven, you can read .sas7bdat and .sas7bcat files with the `read_sas()` function, and SAS transport files (version 5 and version 8) with read_xpt().
haven provides support for labeled and missing data from SAS. Additionally, haven offers options to remove any SAS features, making it easier for users to work with their data exclusively in R.
Databases
R and RStudio give you several options for connecting to databases. From RStudio, the Connections Pane makes it possible to easily connect to a variety of data sources and explore the objects and data inside the connection (for free!). We also offer Posit Professional ODBC Drivers to connect to some of the most popular databases.
3. Working with your data
We recommend R for Data Science (R4DS) as the first stop for learning how to program in R. R4DS, written by Posit’s Hadley Wickham, Mine Çetinkaya-Rundel, and Garrett Grolemund, is a comprehensive guide to using R for data analysis and visualization.
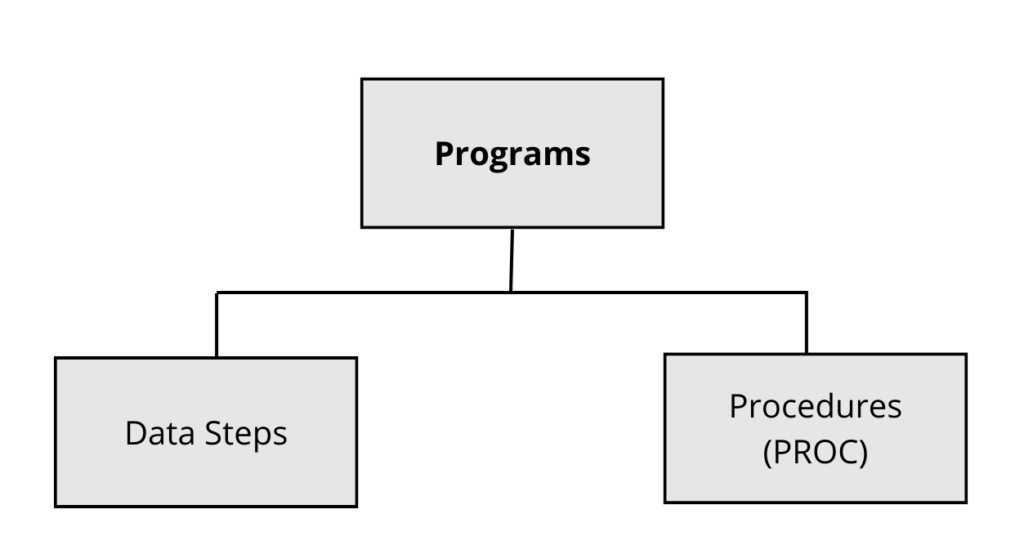
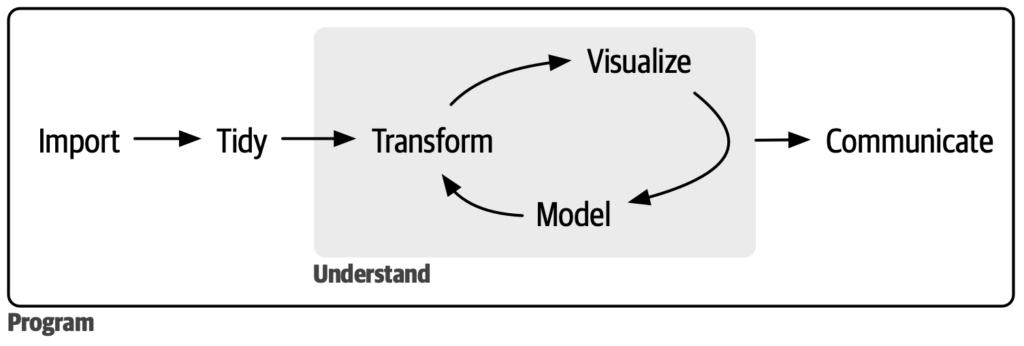
One of the key concepts of the book is the workflow of importing, tidying, transforming, and visualizing data. The typical SAS job looks like: 
R follows a workflow that looks like:

While the same steps may be done in SAS, the manner in which it is done is different in R. R4DS walks through each of these steps using the tidyverse, an opinionated collection of R packages designed for data science. We recommend that users coming from SAS use the tidyverse packages to pick up R (as opposed to starting with base R, which comes built into the R programming language). The tidyverse’s syntax and functionality will feel familiar, and you can quickly start running your data analyses.
The dplyr package from the tidyverse has functions similar to the DATA step and PROC SQL. Another package, tidyr, can reshape and tidy data like PROC TRANSPOSE. The pipe, `%>%`, comes from the magrittr package by Stefan Milton Bache. The pipe expresses a sequence of multiple operations, like saying “AND THEN” between verbs.

The SAS to R cheatsheet by Brendan O’Dowd familiarizes SAS users with R by showing tidyverse examples with equivalent SAS code (link updated April 20th, 2023).
The dplyr package is a popular tool for data manipulation. For example, the sparklyr package allows users to interact with Spark using a dplyr interface, and the dbplyr package allows you to work with databases using dplyr syntax.
4. Tabulating and visualizing your data
SAS PROCs are used to analyze, report, or graph data. In R, you use packages for these operations.
For data visualization, use the ggplot2 package to create high-quality, customizable graphics. The ggplot2 package is based on the grammar of graphics and provides a simple and consistent framework for creating a wide range of plots, including scatterplots, bar charts, histograms, and more. The package provides a range of features for controlling the appearance of plots, such as adjusting color, font, and layout, and supports advanced visualizations, such as faceted and layered plots. It also has a rich ecosystem of extensions created by the community to create innovative charts.
For SAS users, we recommend using the esquisse package to explore and visualize your data interactively. It helps users easily use ggplot2 while generating the code to reproduce the visualizations.
The gt package makes it simple to produce nice-looking display tables. Like ggplot2 above, gt builds layers that users can customize when constructing tables.
5. Writing flexible code with packages and functions
While not synonymous with macros, R’s functions are programming statements you refer to and reuse throughout your script to perform a task. You save a function in an object, and you pass arguments to the function for it to run.
To help organize code, R users add a collection of functions into a package. Packages contain functions, code, and compiled code in a standardized way so that they can be installed and used by different users. Packages can be used for personal/internal use or shared publicly. R packages are installed into libraries, which are directories in the file system containing a subdirectory for each installed package. As Hadley Wickham put it, “A package is a like a book, a library is like a library; you use library() to check a package out of the library.”
Most SAS programmers use a macro library, but you do not need a function library in R. With over 19,000 packages on the Comprehensive R Archive Network (CRAN), R users have thousands of functions contributed by the open-source community at their disposal. And this is only counting the packages that are on CRAN! There are more public packages in repositories like GitHub and Bioconductor.
However, there may be times when the function that you need is not available in an existing package. Writing macros is what separates the average SAS user and the advanced one; creating functions and packages is what separates beginners and pros in R. Once you’re ready to create your own functions, you can check out Hadley Wickham’s Advanced R. And, if your organization needs to save, organize, and distribute private packages, Posit Package Manager is a great solution.
6. Enhancing your output with R Markdown and Quarto
Once you’ve imported your data and created your reports and visualizations, you will want to create a shareable output with these tools. SAS ODS is the output delivery system that helps produce files. In R, we can use R Markdown and its successor, Quarto.
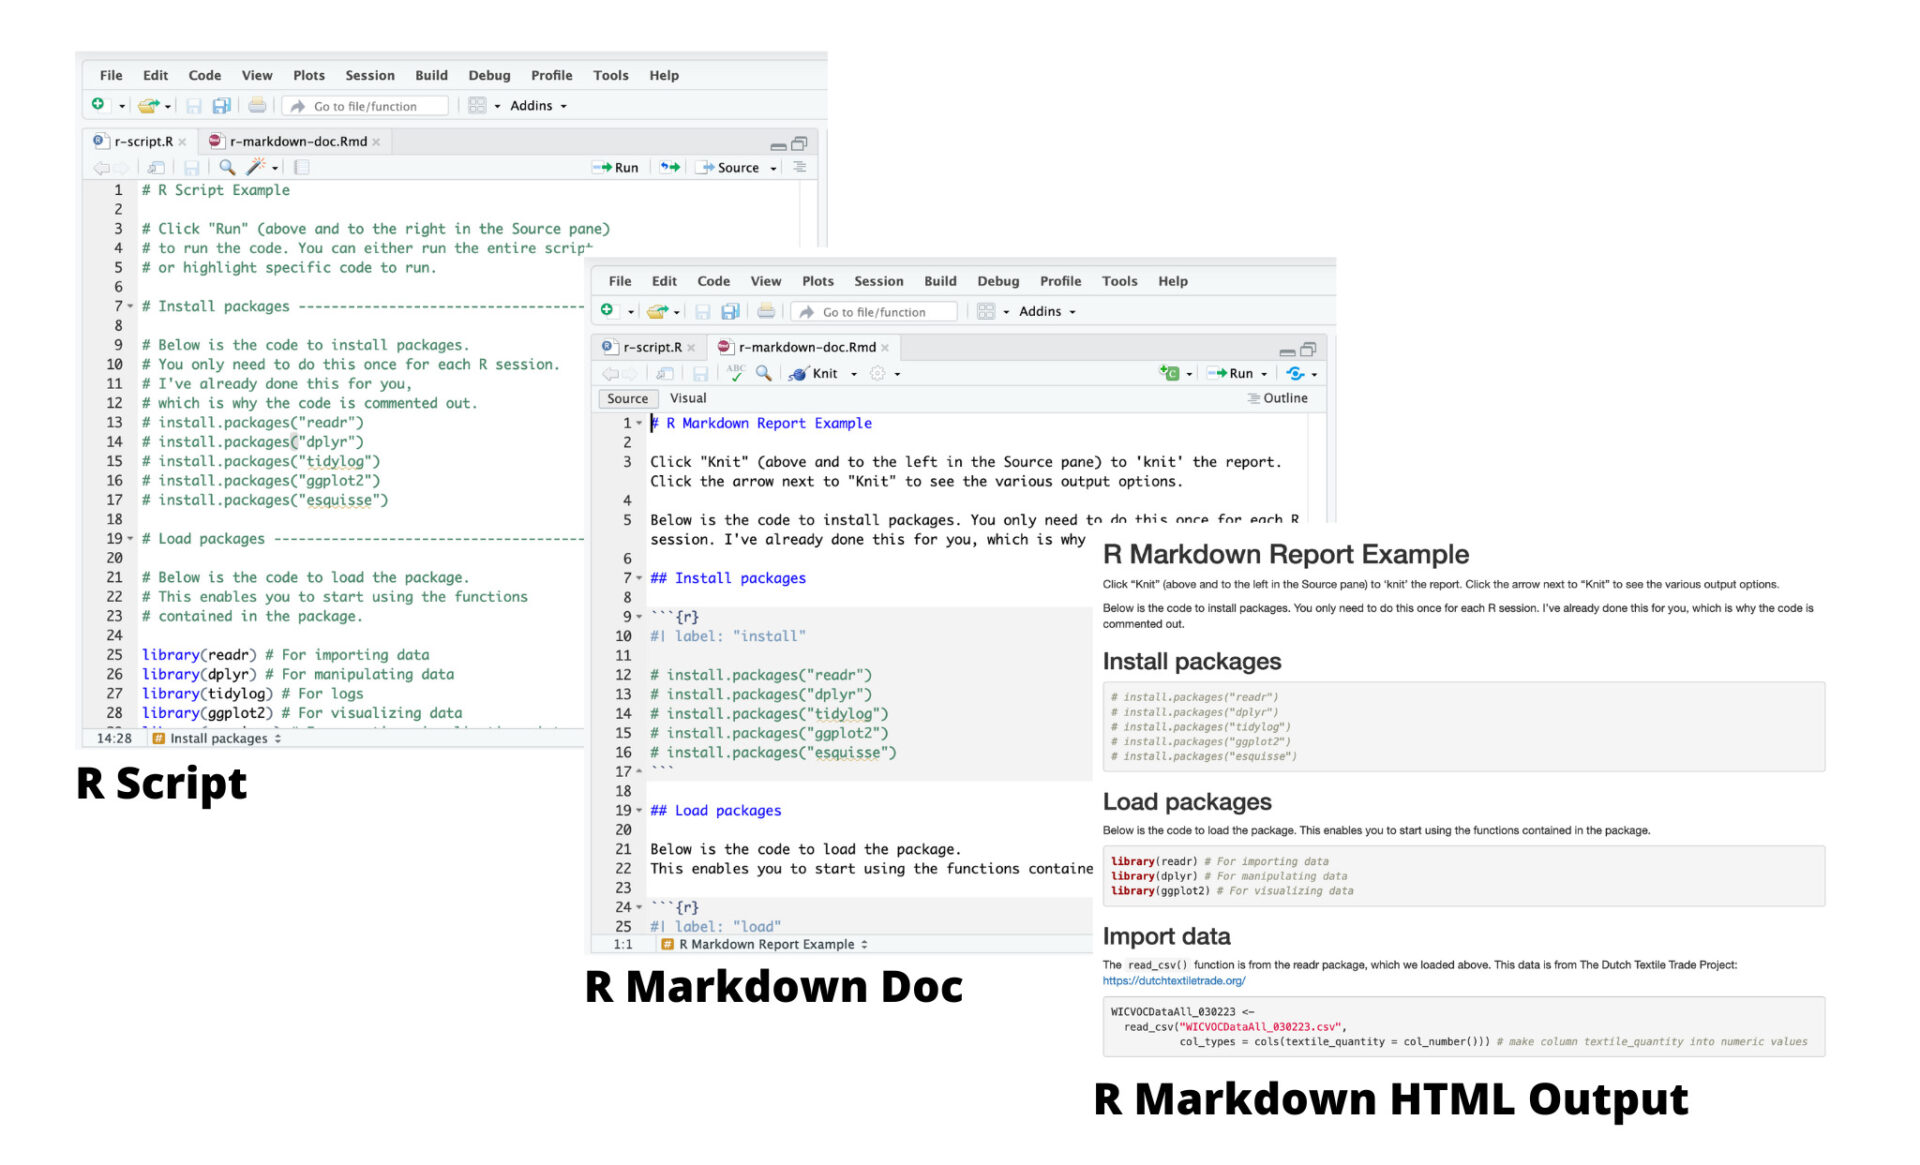
R Markdown and Quarto are powerful tools for implementing the concept of ‘literate programming,’ which involves creating documents that seamlessly integrate text and code. These documents can be saved in the form of .Rmd/.qmd files or notebooks, and offer users the flexibility to output their results in various formats such as HTML, PDF, and Word documents.

Try it out! This Shiny app demonstrates what an R Markdown report looks like in PDF, HTML, and Word.
In the macro section above, you may have wondered about where you list your macro variables. These are similar to R Markdown/Quarto parameters, which you use to create different variations of a report.
7. Using statistical procedures in R
On to the statistics part of our programming. We recommend using tidymodels, a collection of packages for modeling and machine learning using tidyverse principles. The Tidy Models with R is a great resource for getting started with tidymodels.
If you are looking to run statistical analyses not available in tidymodels, there are many other packages available. The book, An Introduction to Statistical Learning, is another great resource (please note that it is in base R). The members of the pharmaverse, a connected network of companies curating open-source R packages for clinical reporting, proves a list of useful statistical packages, including:
- stats – Base R package with a lot of functionality useful for the design and analysis of clinical trials
- survival – Core survival analysis routines
- car – R companion to applied regression
- emmeans – Estimated marginal means, aka least-squares means
- mmrm – Mixed models for repeated measures (link)
- lme4 – Fit linear and generalized linear mixed-effects models
- lmerTest – Tests in linear mixed effects models
8. Exporting your data
The readr package, mentioned in the ‘getting your data into R’ step, can also be used to export data from R into flat file formats.
The haven package can write SAS transport files (note, the write_sas() function is currently experimental and only works for limited datasets), and the xportr package can export files that meet clinical standards.
We will cover more about this topic in our next post!
9. Debugging your R programs
We’re not going to lie to you… debugging R, like debugging SAS, can be challenging. There are various tools in the R ecosystem that can help with debugging, as described in this Posit article. The tidylog package mentioned above can help document your code execution, and programmers can review the logs. Advanced R also has a chapter on debugging.
10. Learn about R’s particular capabilities
People often desire to share “interactive” statistical concepts with collaborators. The Shiny package helps statistical programmers share their analysis with people via web applications. Shiny allows programmers to write R code translated to CSS, HTML, and Javascript (such as Plotly). This helps people to digest and navigate with intention the data faster and helps minimize the time from question to answer.
You can learn more about Shiny in the Mastering Shiny book.
Continue the journey
We hope that the resources above were helpful in your first steps in R. There is much to learn, and we are excited for you!
- Want to see an entire analysis workflow in R from start to finish? Check out From SAS to R, presented at R/Medicine 2021 by Joe Korzun, Data Scientist Consultant at Procogia, and Introduction to R for SAS programmers by Sadchla Mascary, Stefan Thoma, Zelos Zhu, and Thomas Neitmann.
- If you are looking for a customized learning experience, Posit Academy provides a cohort-based, mentor-led data science apprenticeship for professional teams. Posit experts provide training that focuses on learning and applying R to the data and challenges that teams and organizations tackle every day. Schedule a call to learn more.
Translate between R and SAS code
While we recommend learning R from the ground up, we realize there is utility in seeing equivalent actions in SAS and R. Find some resources here:
- The SAS to R cheatsheet familiarizes SAS users with R by translating SAS functions into the tidyverse.
- The arsenal package from the Mayo Clinic has 6 main functions, each motivated by a local SAS macro or procedure of similar functionality.
- For a pharma-specific resource, check out the SAS and R book by Bayer Oncology SBU.
- The Library of Statistical Techniques provides examples of how to execute statistical techniques in open-source statistical software, so you can see the R equivalent of that command you know in Stata or SAS. Please note that this resource uses base R.
- The R for SAS and SPSS Users (free version, paid version) compares programs written in SAS, SPSS, and the R language. Please note that this resource uses base R and is from 2011.
- The sassy system is an integrated set of packages designed to make programmers more productive in R, particularly those with a background in SAS software.
- The pharmaverse also has packages that help replicate SAS functionality, like logrx mentioned above.
Stories of successful adoption of R in organizations
Watch these success stories that provide insights into best practices, pitfalls to avoid, and strategies for overcoming common challenges when adopting R in a SAS organization:

