Improved insights on Posit product usage with the latest release of Chronicle


Posit Chronicle is an included visibility service, free to all Posit customers, designed to help data science managers and leaders understand their organization’s use of Posit Connect and Posit Workbench. Turn usage metrics into actionable insights for proactive planning and growth that proves the value of your data science investment.
Chronicle takes the task of extracting and collecting usage metrics from each Posit product to a central location in a standardized, tabular format ready for further analysis or reporting. No longer do you have to write your own code for calling APIs and managing your data lifecycle. Whether you have a single server or dozens, Chronicle brings all of your usage together in one place, making it easy to understand how your organization is leveraging Posit products.
The latest release of Chronicle (2026.01.0) adds two improvements that change how you work with usage data from Posit Connect and Workbench: prebuilt Shiny applications for reporting and curated data sets. Together, these features reduce the time between asking a question about your Posit products and getting an answer.
Chronicle Reports R Package
The Chronicle Reports R package has been redesigned to work with new curated datasets. The package now includes two prebuilt Shiny apps for reporting on Workbench and Connect usage. The result is a simpler, faster experience for admins who want to generate reports or explore data interactively.
Pre-Built Shiny Applications
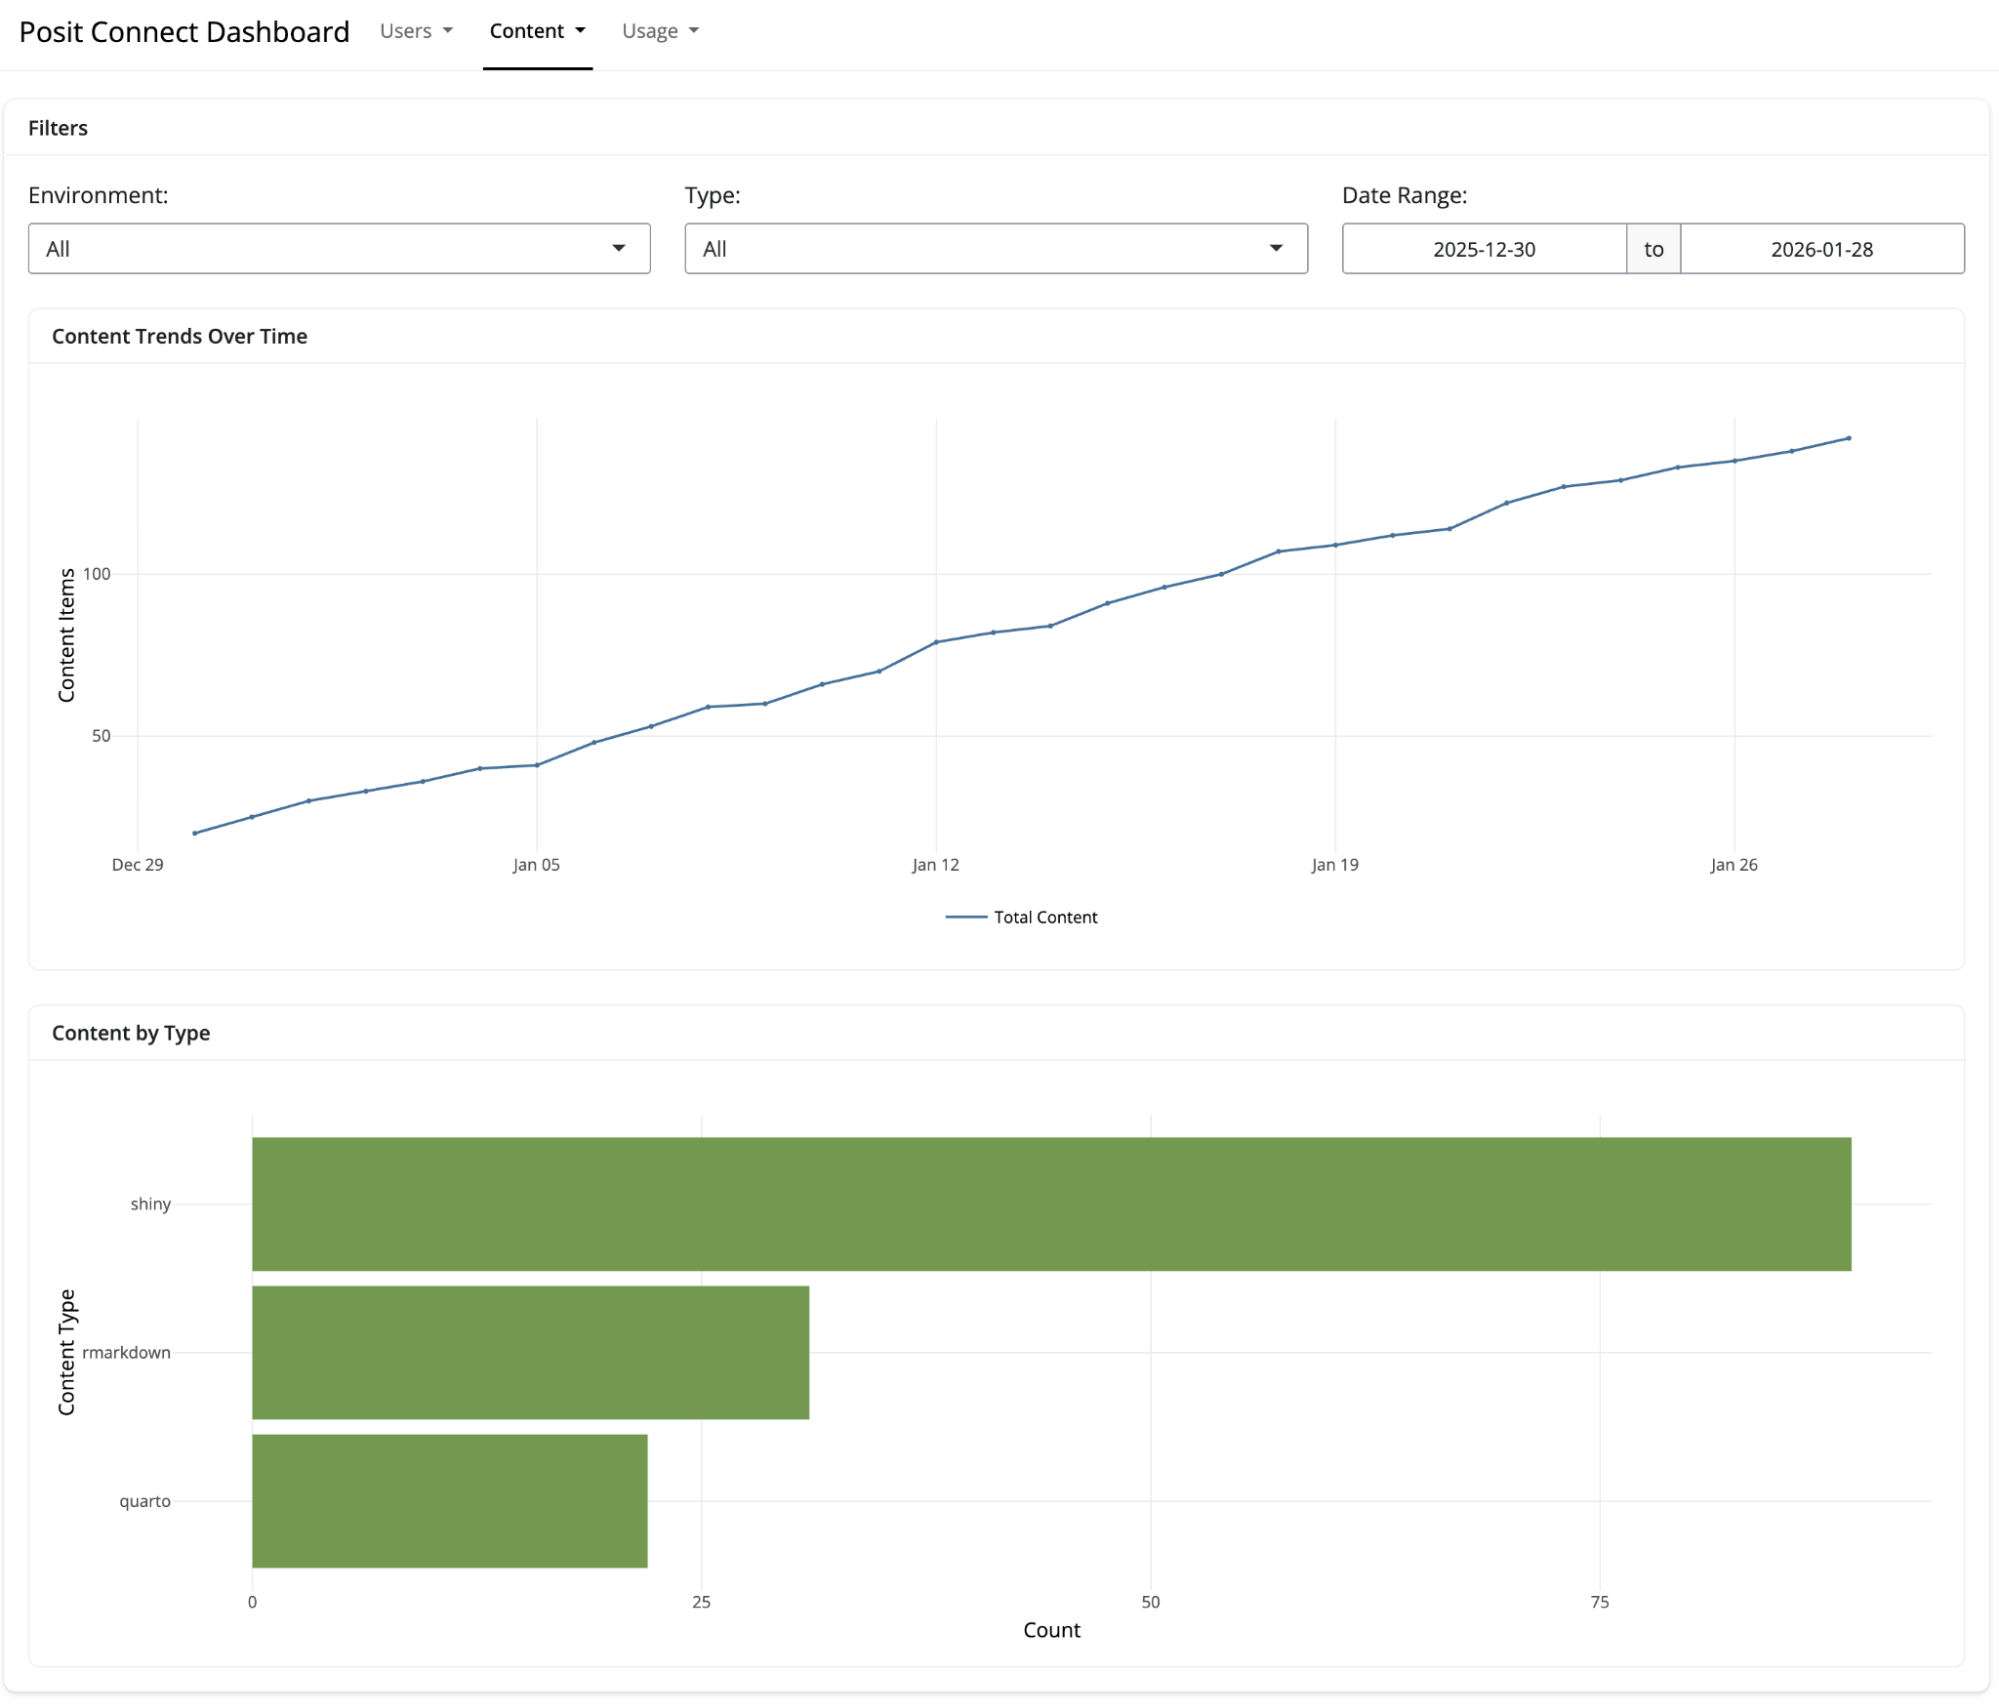
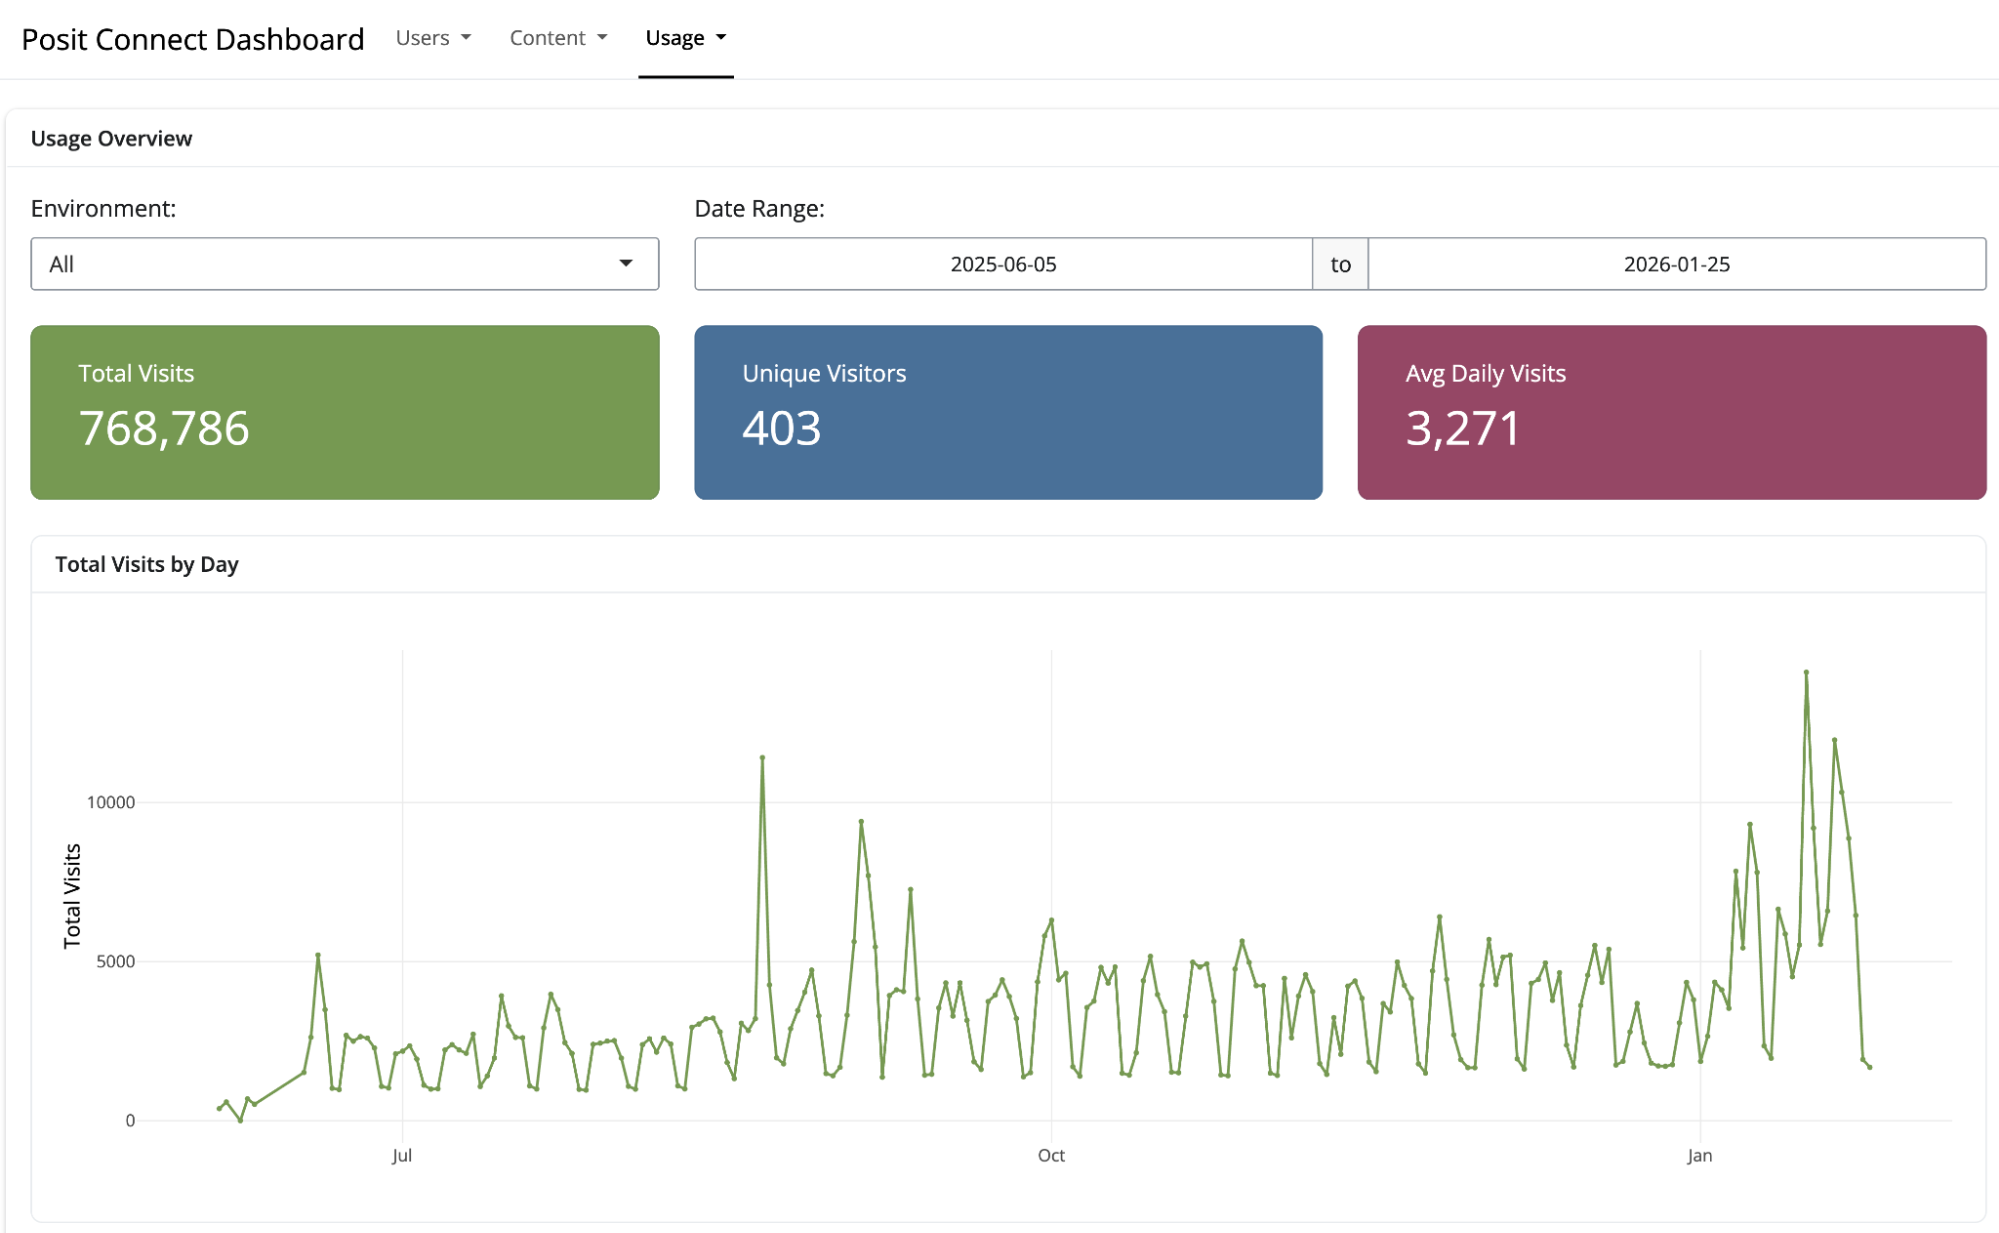
The package includes interactive Shiny applications for exploring Connect and Workbench usage. Launch either of them with a single function call:
chronicle_run_app("connect")
chronicle_run_app("workbench")
These applications provide:
- User activity trends over time
- Content popularity rankings
- Visit patterns by time of day and day of week
- Filtering by date range, user, and content type
The applications work well for ad-hoc exploration during planning meetings or stakeholder conversations. They require no custom development and update automatically as new data arrives.
Use Case: On-Demand Usage Exploration
A team lead meeting with their data science group wants to understand which Shiny applications are getting the most usage and whether any content has been abandoned. Rather than preparing a custom analysis in advance, they launch the Connect usage application and explore interactively during the meeting.
The team identifies several dashboards with sustained high usage (candidates for performance optimization) and a few applications that haven’t been accessed in months (candidates for review with their owners). The conversation is grounded in current data without requiring pre-meeting preparation.
Use Case: Automated Monthly Reporting
A data engineer building automated reports for department heads can use the helper functions to pull curated data and generate summaries. Because the data is already clean and consistent, the report code focuses on presentation rather than data wrangling. The resulting pipeline is easier to maintain because the complexity lives in Chronicle’s daily curation process rather than in the report code.
Simplified Data Access
New helper functions read curated datasets from local storage or S3 with minimal configuration:
library(chronicle.reports)

# Read user totals for Connect
user_totals <- chronicle_data("connect/user_totals")

# Filter to the last 90 days
start_date <- Sys.Date() - 90
recent_totals <- user_totals |>
  filter(date >= start_date) |>
  collect()
The functions handle path construction, partitioning, and format detection automatically. You write dplyr queries against clean data rather than implementing schema-specific loading code.
Faster Answers with Standard Views
We are now extending Chronicle’s convenience with hourly and daily aggregations that provide complete metrics for custom analysis. New curated datasets build on this foundation by pre-computing answers to common questions, so you spend less time on data preparation and more time on decisions.
Consider a question like “How many active users do we have on Connect?” The answer depends on several choices:
- How to handle users who appear in multiple environments (common in load-balanced deployments)
- Which account states to include (locked, unconfirmed, inactive)
- What time window defines “active”
These are reasonable choices that different analysts might make differently. Curated datasets establish consistent definitions that apply automatically, so everyone working with the data starts from the same baseline.
Curated Datasets: Pre-Processed and Report-Ready
Curated datasets address this by moving data preparation into Chronicle itself. Each day, Chronicle processes the raw aggregated data and generates clean, consistent datasets optimized for common reporting questions.
For Posit Connect, curated datasets include:
- User List - Deduplicated list of named users across environments with role information, activity status, and timestamps
- User Totals - Daily counts of named users and active users (1-day and 30-day activity windows), including role distribution and license seat usage
- Content List - Complete inventory of content items with configuration details, resource limits, runtime settings, and deployment information
- Content Totals - Daily counts of content grouped by type (Shiny, R Markdown, Quarto, APIs) and environment
- Content Visits Totals by User - Daily counts of content visits, grouped by user and content item
- Shiny Usage Totals by User - Daily counts of Shiny sessions and total usage duration, grouped by user and content item
For Posit Workbench, curated datasets include:
- User List - Deduplicated list of active users across environments with role and activity information
- User Totals - Daily counts of named users and active users, including role distribution and license seat usage
All curated datasets share several characteristics that make them easier to work with:
- Pre-filtered - Locked, unconfirmed, and inactive accounts are excluded
- Pre-deduplicated - Users and content appearing in multiple environments are consolidated by email or username
- Partitioned by date - Hive-style partitioning makes time-range queries efficient
- Tool-agnostic - Stored as Parquet files, readable by R (arrow, dplyr), Python (pandas, polars), DuckDB, and any Parquet-compatible tool
Use Case: License Renewal Preparation
A data science manager preparing for annual license renewal can open the User Totals dataset and immediately see trends in named user counts and active user counts over the past year. The 30-day activity window helps distinguish between users who log in regularly and those who have accounts but rarely use them. This information supports conversations with procurement about whether to maintain, expand, or reduce seat counts.
Previously, generating this view required custom code that implemented deduplication logic and activity definitions. Now the definitions are consistent, documented, and applied automatically.
Use Case: Quarterly Access Reviews
Organizations in regulated industries conduct periodic access reviews to verify that only authorized personnel have accounts on data science systems. The User List dataset provides a clean, deduplicated view of all users across Workbench environments, including activity timestamps that indicate when each user last logged in.
An IT administrator can export this list directly for compliance review rather than manually merging exports from multiple environments and cleaning up duplicate entries.
Use Case: Content Lifecycle Management
Data science teams accumulate content over time, like dashboards created for one-time projects, reports that were superseded by newer versions, API endpoints that no one calls anymore. The Content List and Content Visits datasets help identify candidates for cleanup.
A team lead can query for content that hasn’t received visits in six months, review whether those items should be archived or deleted, and free up resources for active projects. The Content Totals dataset shows how the content portfolio has changed over time, which can inform decisions about where to invest development effort.
Who has access to my usage data?
Your data remains yours. All data collected by Chronicle stays in your own environment (stored either on local disk or S3), under your own control. You choose what data gets shared and with whom.
Is there a cost involved? How do I get started?
Chronicle is a free, included capability available now to all Posit customers – no separate license is required. Installation is simple and only requires deployment of a single, centralized metrics collection server, along with a small telemetry agent alongside each server running Connect or Workbench.
Upgrading to 2026.01.0
If you’re running Chronicle 2025.08 or earlier, upgrading to 2026.01.0 triggers automatic backfill of curated datasets for your historical data. You don’t need to wait for new data to accumulate—your existing metrics are processed into a curated form during the first daily aggregation after the upgrade.
Curated datasets are stored in a /curated directory alongside your existing /hourly and /daily directories. They use the same storage backend (local disk or S3) as your current installation.
The previous Chronicle Metrics Cookbook remains available as a reference for developers who want to understand the raw data schema or build custom aggregations. For new projects, we recommend starting with the Chronicle Reports package and curated datasets.
Getting Started
Documentation for curated datasets and the Chronicle Reports package is available in the Chronicle Admin Guide. The guide includes schema documentation for each curated dataset, example queries in R and Python, and configuration options for the Reports package.
If you have questions or feedback about curated datasets, reach out to your Posit customer success manager. We are ready to help!

Jeremy Allen
Related Content

MCP Servers on Connect: Managing credentials and access

Score a Disease Surveillance Model Inside Snowflake, Without Moving
