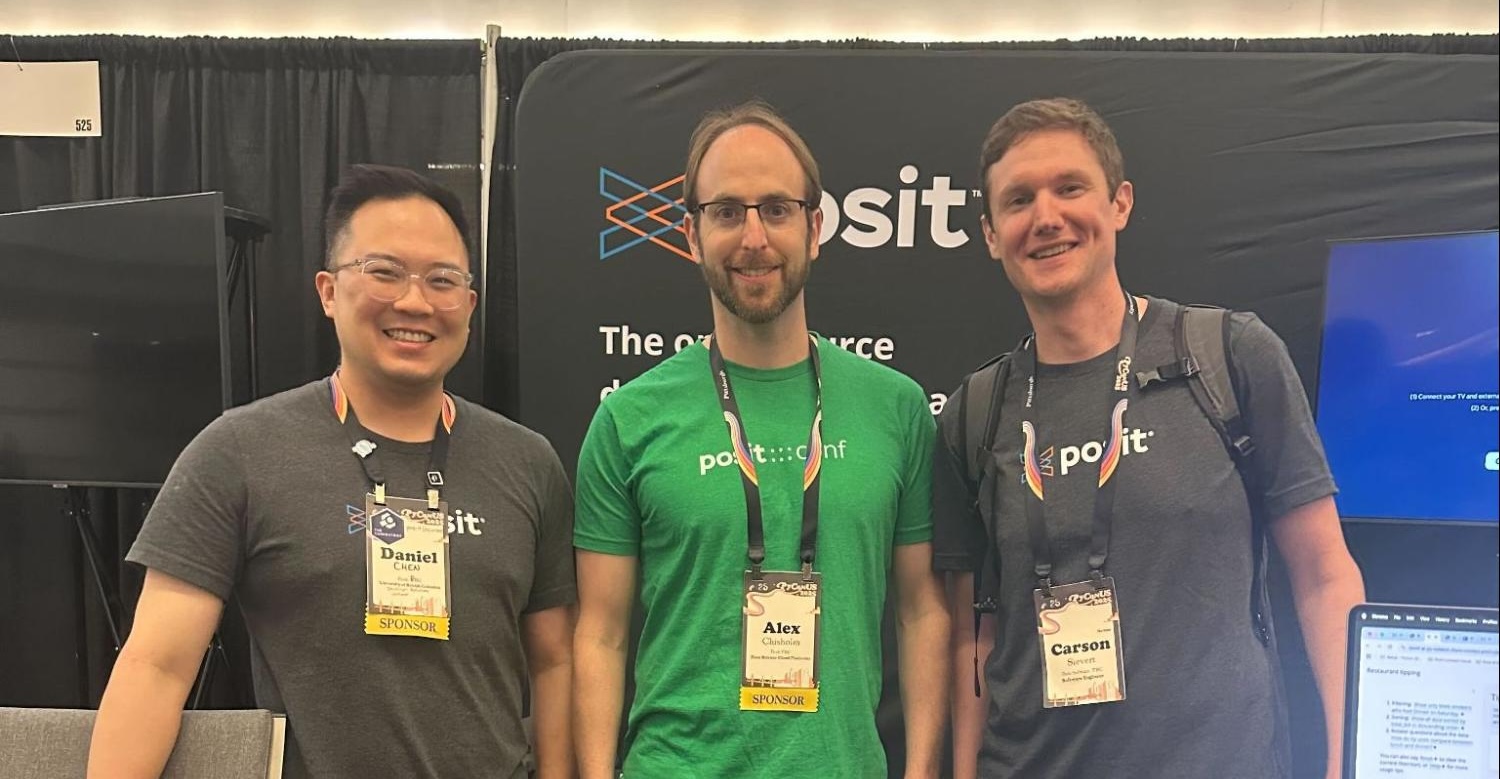
Posit @ PyCon US 2025: Try Our Demo Labs!

Level up your Python
Interested in more valuable Python tutorials and updates? Join our email list.
We had an awesome time meeting tons of people in the Python community at PyCon 2025 last month. Our team was busy chatting, sharing ideas, and really learning what the Python community is up to. To give everyone a solid picture of what we’re all about, we put together a demo website to show off our open-source tools. Folks got to dive in and see how our stuff can make their data work easier and more collaborative. If you missed us at the conference you can try out each of our demos yourself. Each demo takes about 5 - 10 minutes to complete. We’ll walk you through all the cool things on it in the sections that follow, so you can see Posit in action.
You can check out our demo lab website at: https://pos.it/pycon2025.
Dashboards with Shiny
Lab: https://posit-dev.github.io/pycon2025/tutorials/shiny/shiny-express.html
Shiny: https://shiny.posit.co/py/
Shiny makes it easy to create rich, interactive experiences in pure Python with a fully reactive framework. No JavaScript required!
We guide you through an example Shiny app that examines the bill length distributions of different penguin species and how they compare to all penguin species.
#| '!! shinylive warning !!': |
#|   shinylive does not work in self-contained HTML documents.
#|   Please set `embed-resources: false` in your metadata.
#| standalone: true
#| components: [editor, viewer]
#| viewerHeight: 700

from palmerpenguins import load_penguins
from plotnine import aes, geom_histogram, ggplot, theme_minimal
from shiny.express import input, render, ui

dat = load_penguins()
species = dat["species"].unique().tolist()

ui.input_radio_buttons("species", "Species", species, inline=True)


@render.plot
def plot():
    sel = dat[dat["species"] == input.species()]
    return (
        ggplot(aes(x="bill_length_mm"))
        + geom_histogram(dat, fill="#C2C2C4", binwidth=1)
        + geom_histogram(sel, fill="#447099", binwidth=1)
        + theme_minimal()
    )
GenAI with chatlas and querychat

Lab: https://posit-dev.github.io/pycon2025/tutorials/shiny/shiny-ai.html
Chatlas: https://posit-dev.github.io/chatlas/
Querychat: https://github.com/posit-dev/querychat
Querychat Shiny template: https://shiny.posit.co/py/templates/querychat/
Querychat restaurant tipping template: https://shiny.posit.co/py/templates/sidebot/
We’ve developed open-source tools to help interact with the growing interest in GenAI. Meet chatlas, an agnostic way to connect to all the different chat providers (OpenAI, Antropic, GitHub, Ollama, etc.) and an easy way to build LLM chat applications. Our lab also expands on chatlas to make it easier to interact with your dashboards by using natural language queries in querychat.
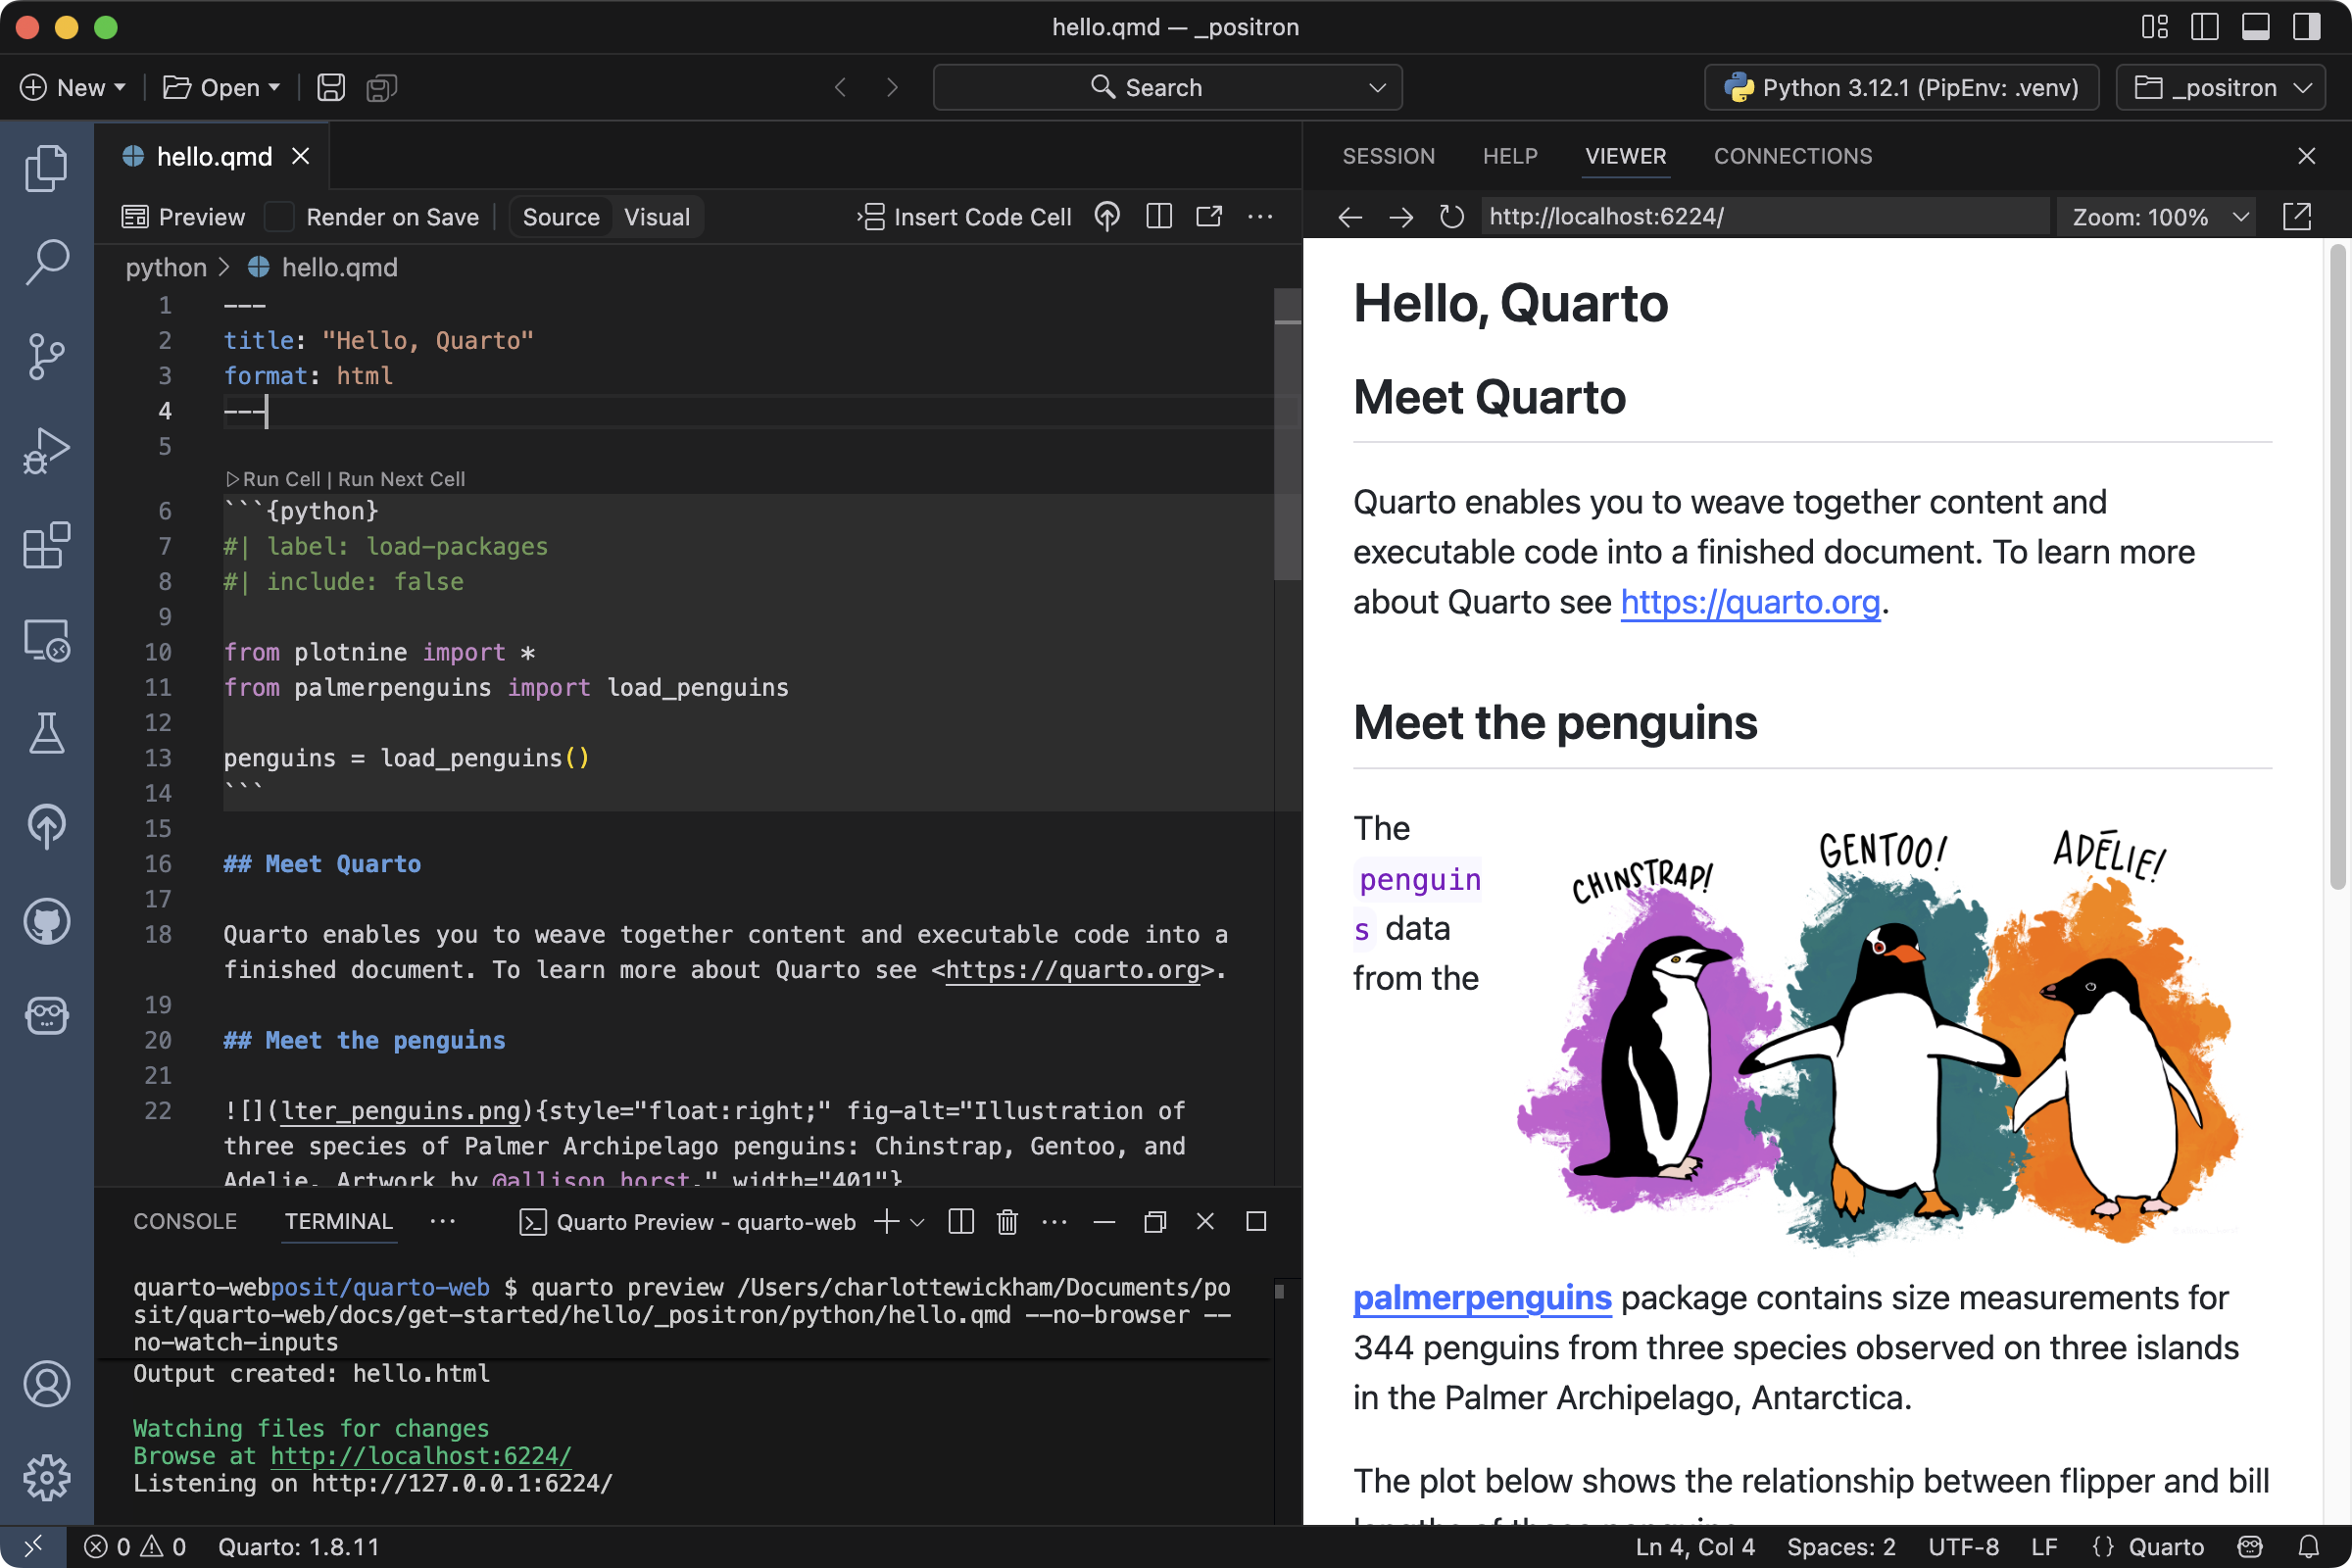
Technical documents with Quarto
Lab: https://posit-dev.github.io/pycon2025/tutorials/quarto/
Quarto: https://quarto.org/
Quarto is a technical publishing system that allows you to create reports, websites, documentation, manuscripts, books, presentations, and dashboards. You can incorporate prose text with code output so your documents and reports are always up to date.
Publishing with Posit Connect Cloud
Have a data science project and need a way to deploy and share it? Posit Connect Cloud gives you a way to share all your Python projects (e.g., Shiny, Streamlit, Jupyter, Dash, Bokeh, etc). All you need is a GitHub repository for your project and Connect Cloud can deploy it from there.
Lab: https://posit-dev.github.io/pycon2025/tutorials/connect/deploy-shiny.html
Connect Cloud: https://connect.posit.cloud/
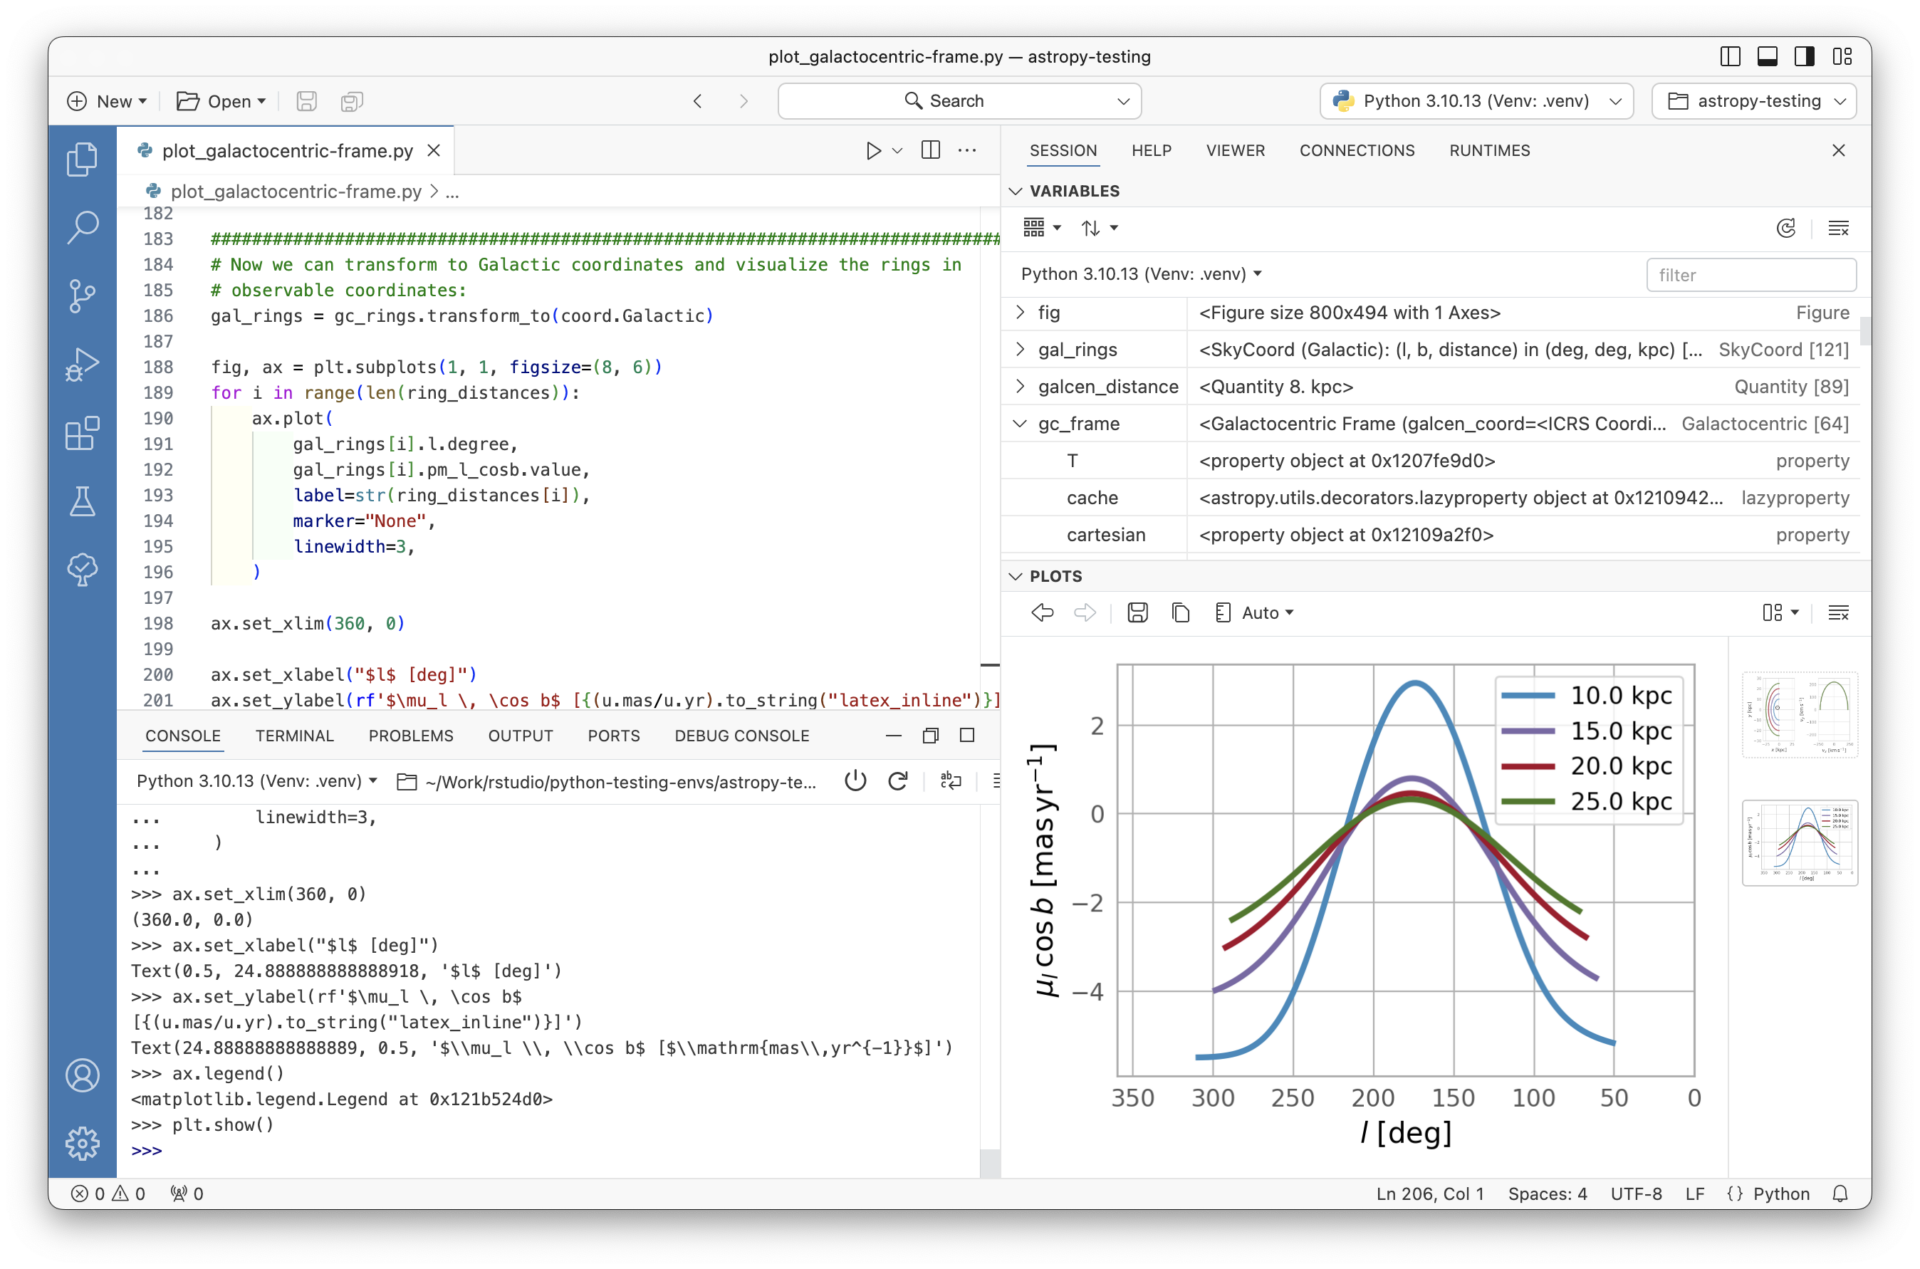
Positron - a new data science IDE
Lab: https://posit-dev.github.io/pycon2025/tutorials/positron/positron.html
Positron: https://positron.posit.co/
Positron, a next-generation data science IDE currently in public beta, offers data scientists an improved tool for data-focused workflows. If you’re seeking a better experience for tasks such as exploratory coding, variable and dataset examination, plot interaction, and the development of data applications like Shiny, Streamlit, or FastAPI, we encourage you to try it out!
Keep in touch after PyCon US
These demos are just the beginning—we have even more to share! Let’s keep the conversation going:
- Subscribe to our emails to learn about our products, blog posts, and other upcoming events.
- Looking for something more infrequent? Subscribe to “Stories” to receive our quarterly Glimpse newsletter, which comes packed with open source updates.
- Join us at an upcoming Data Science Hangout for a casual discussion with a data science leader.
Related Content

MCP Servers on Connect: Managing credentials and access

Score a Disease Surveillance Model Inside Snowflake, Without Moving
