Winner of the 2025 Plotnine Plotting Contest

Introduction
The plots have spoken, and I am delighted to announce the winners of the 2025 plotnine Plotting Contest!
This was only our second time running the contest, and what I have come to love most are the surprises. As the package author, my default mindset is shaped by questions like: What should plotnine be used to visualise? What are its limitations? Where does it shine? But every year, the submissions push far beyond those boundaries. Even within the expected boundaries, they show that creativity and elegance can live inside rather familiar patterns. It reminds me that the true potential of a library is what its community sees in it, rather than its creator.
Evaluation
This time, our three judges were Daniel Chen (GitHub, Website, LinkedIn); Gina Reynolds (GitHub, Website, LinkedIn); and Jeroen Janssens (GitHub, Website, LinkedIn).
They scored the submissions based on:
- Aesthetics
- Technical Impression
- Code comments and/or narrative
- Creative bonus
The metrics have associated weights, and the final score is the weighted sum from all the judges. We carried forward these evaluation criteria from the last running; they served us well.
And drum rolls please.
The Winner
Tracking Canada’s Labour Statistics
By Victor Yuan – GitHub, LinkedIn, Website
We are happy to announce Victor’s Canada Labour Statistics visualisation as the winner of the 2025 Plotnine plotting contest.
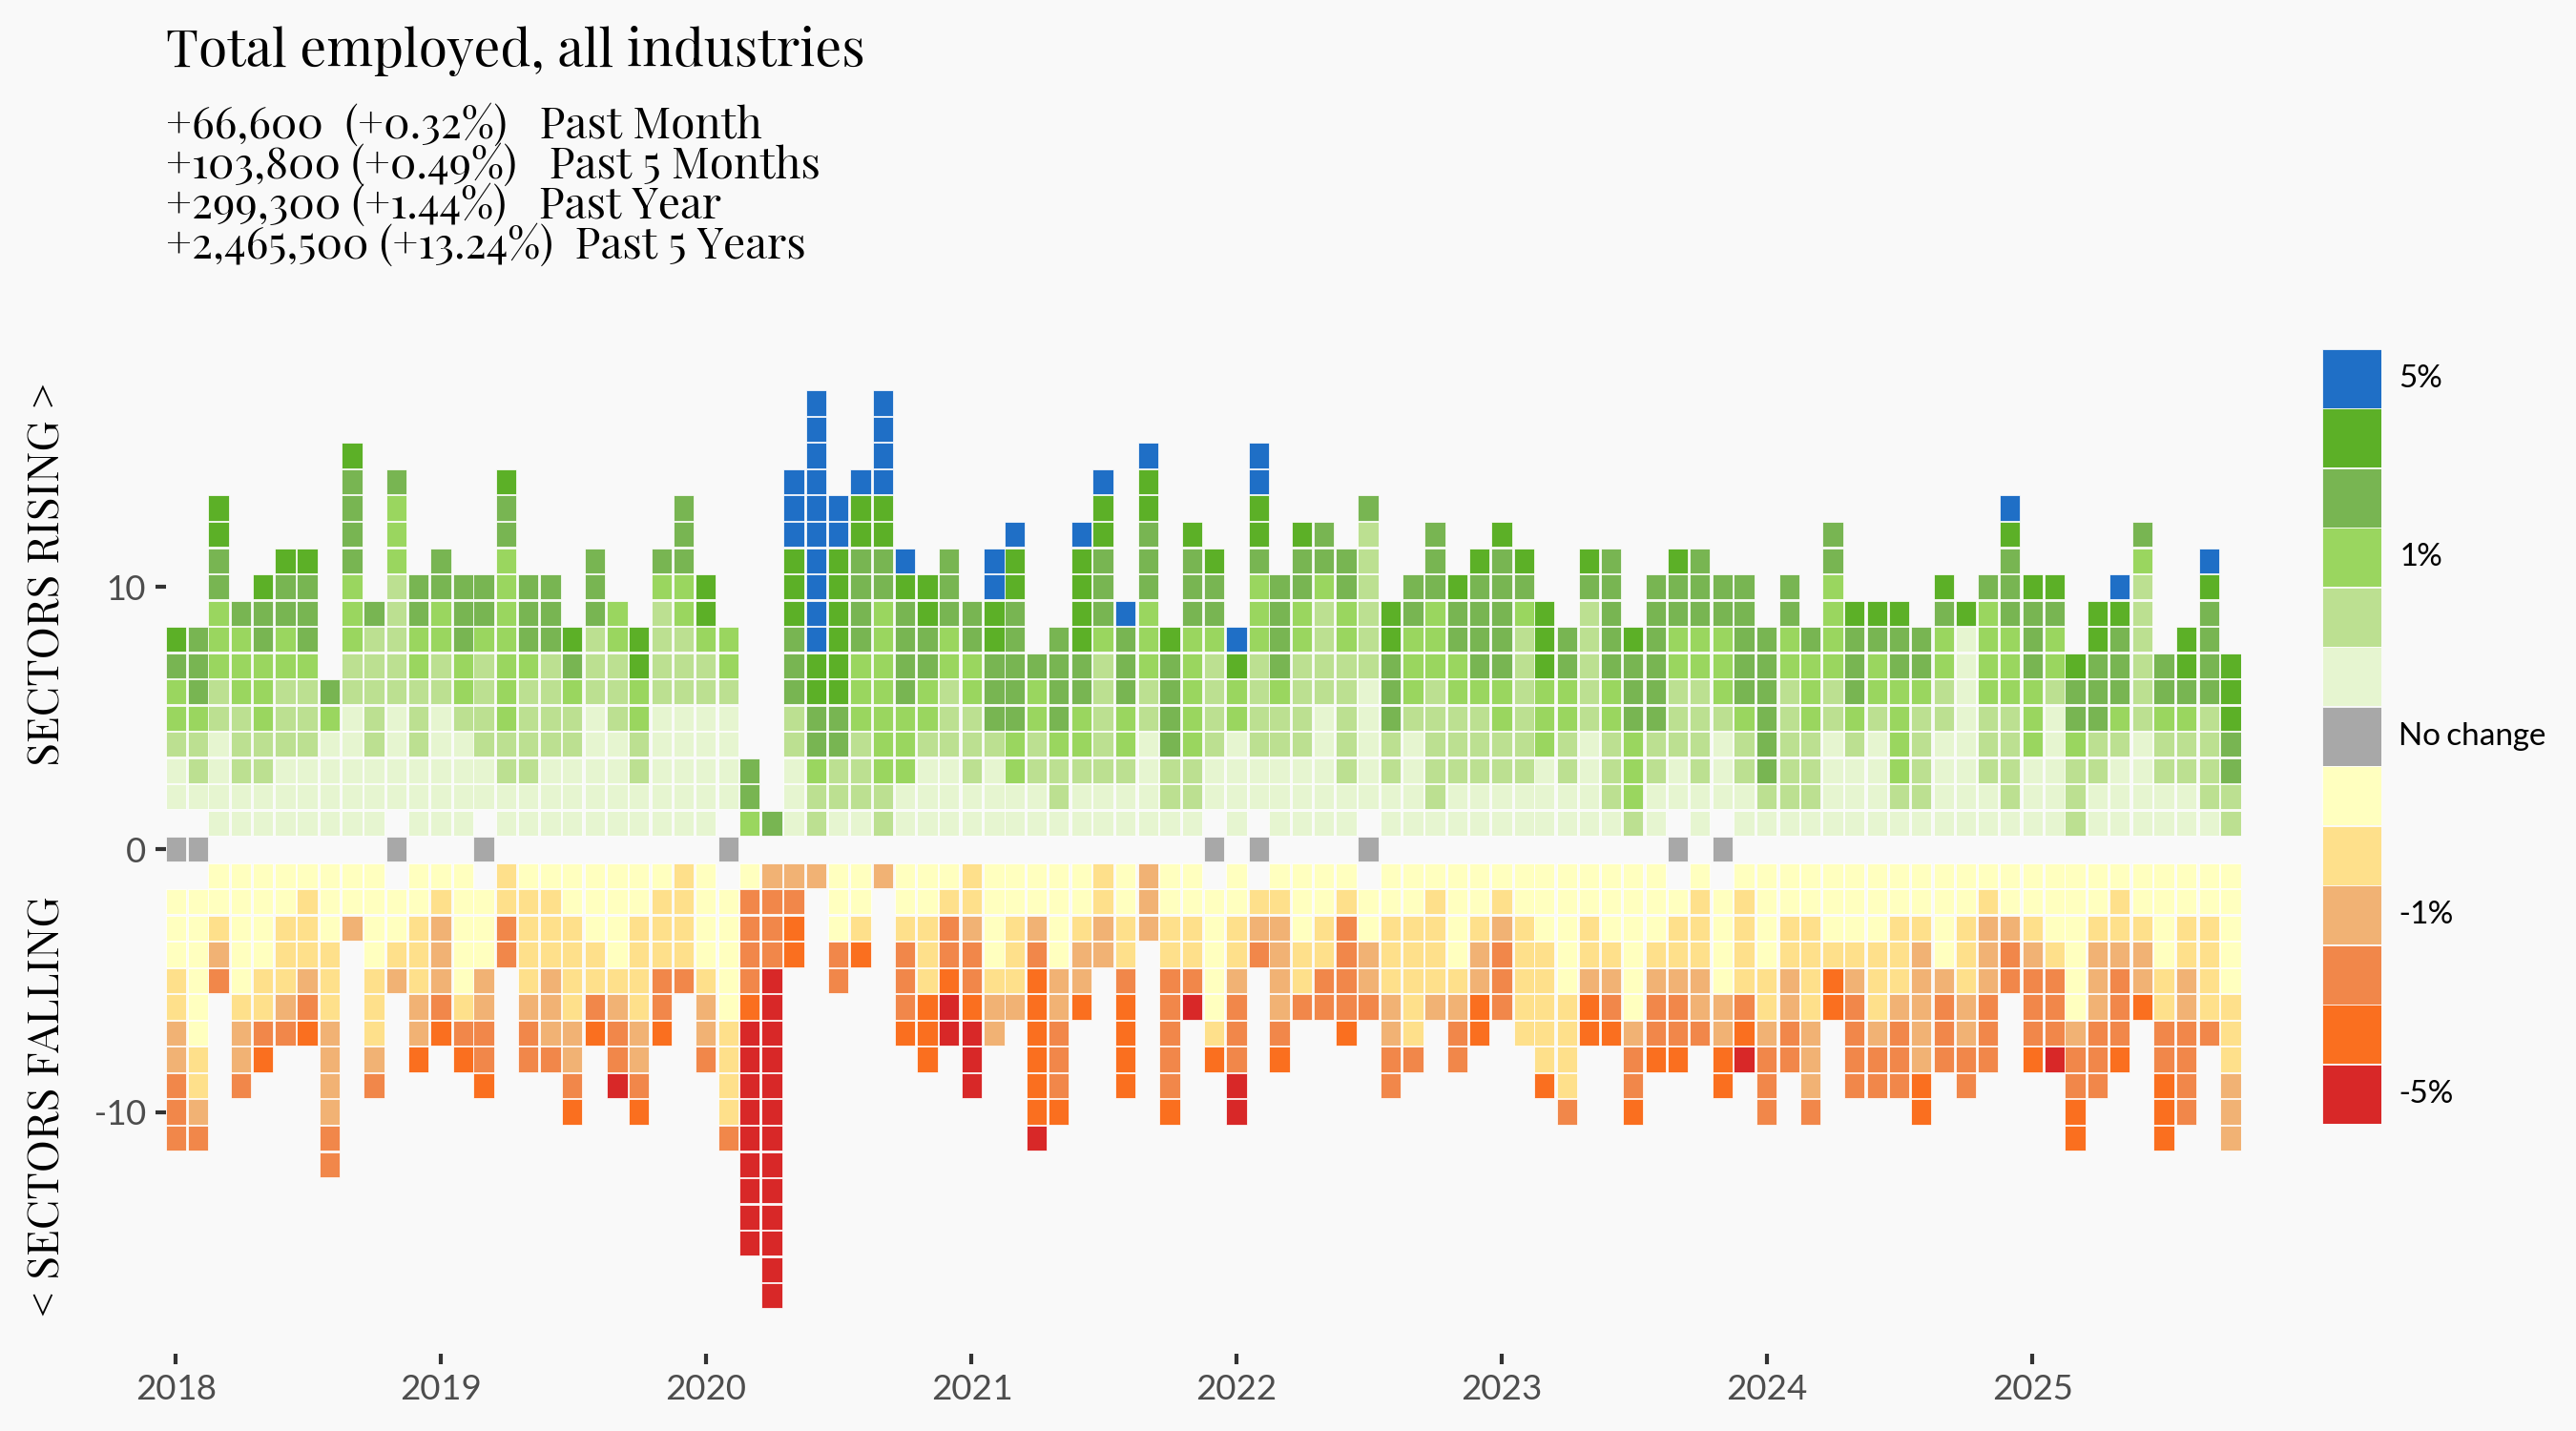
The backdrop of this visualisation is an aggregate of all the categories of industries. It encodes three dimensions. While the Grammar of Graphics makes it easy to encode dimensions into visual elements, i.e., aesthetic mapping, this visual shines because of what it has chosen to represent, and how it represents it: time along the horizontal, ranking of the percentage change in employment numbers on the vertical, and the percentage change itself as a colour.
Yet there is more information in the backdrop than the explicit dimensions; for each year, the vertical range of the tiles encodes the performance of the job market across all industries. At first, it is hidden, then it is obvious. This is a range plot! The entire job market moves down between 2020 and 2023 and then moves up in 2024. The deliberate choice of the colours at lower and higher ends of the colour scale attracts the eye to the changes that need scrutiny. For an ordinal variable, why would a blue follow a sequence of greens in the colour scale? Well, to catch your attention. An enallage is a figure of speech where wrong grammar is used deliberately for an emphatic stylistic effect; Victor’s choice achieves a similar effect.
Well, we was gifted.1
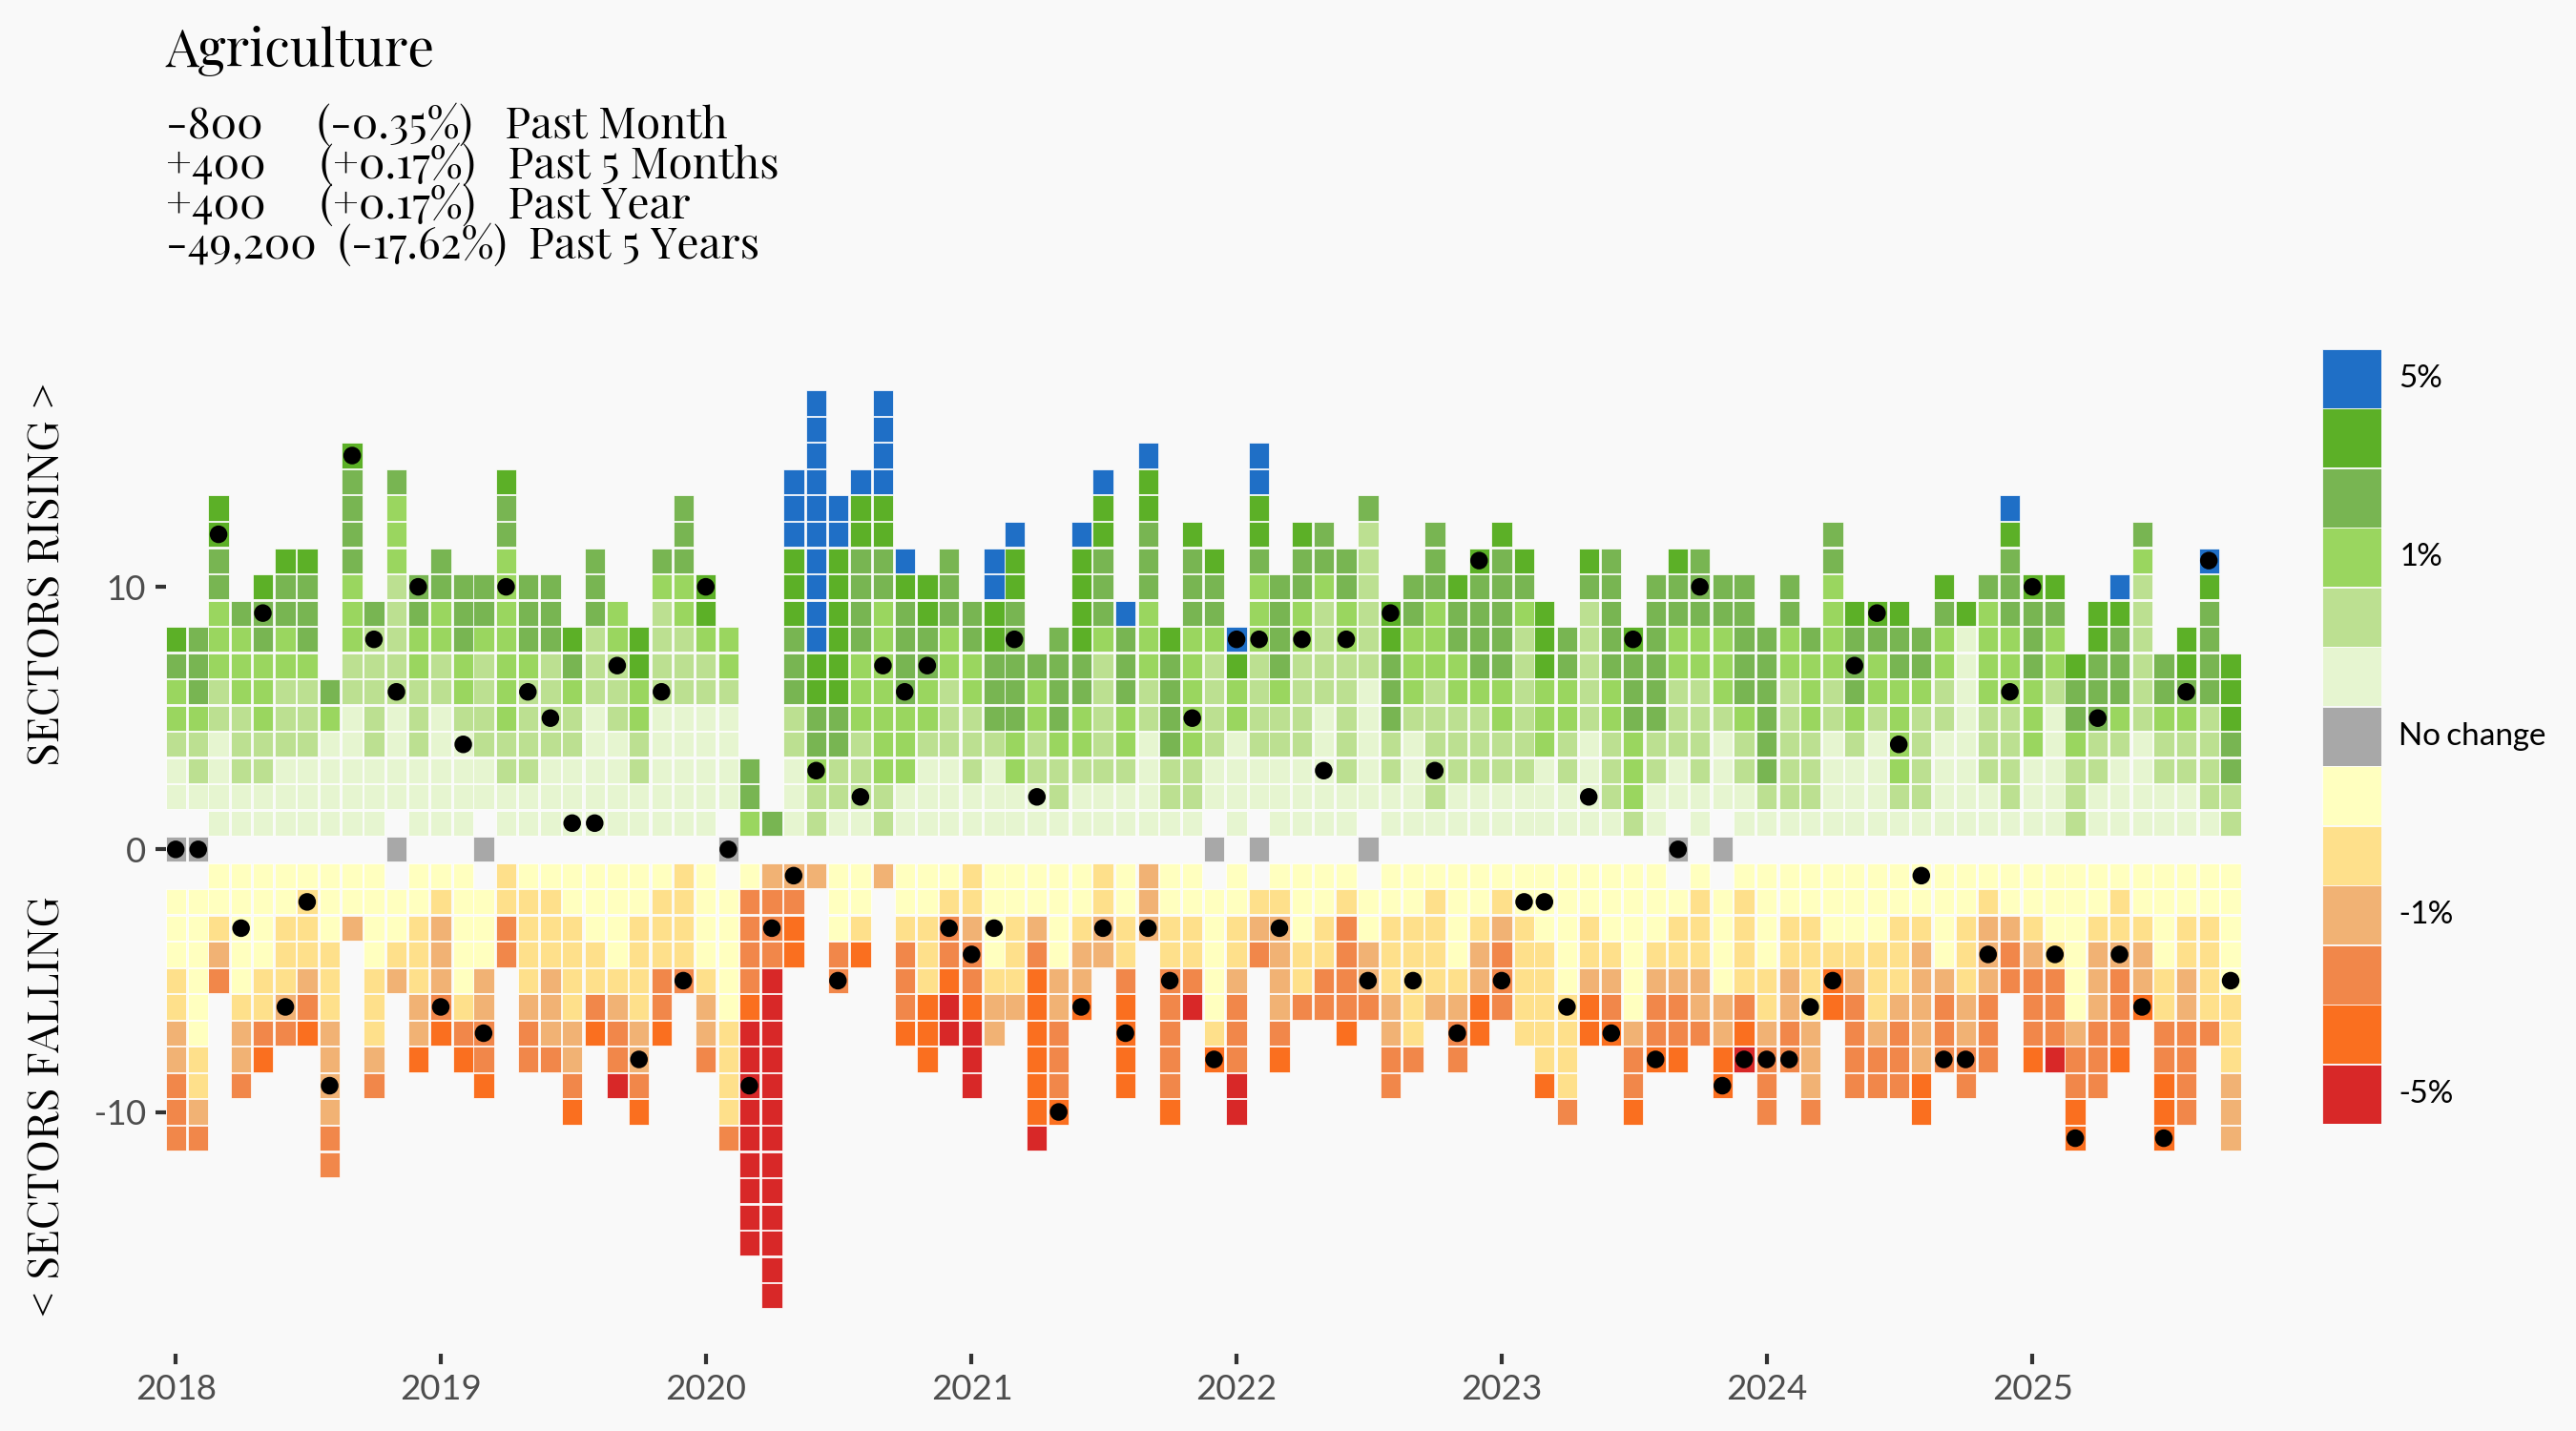
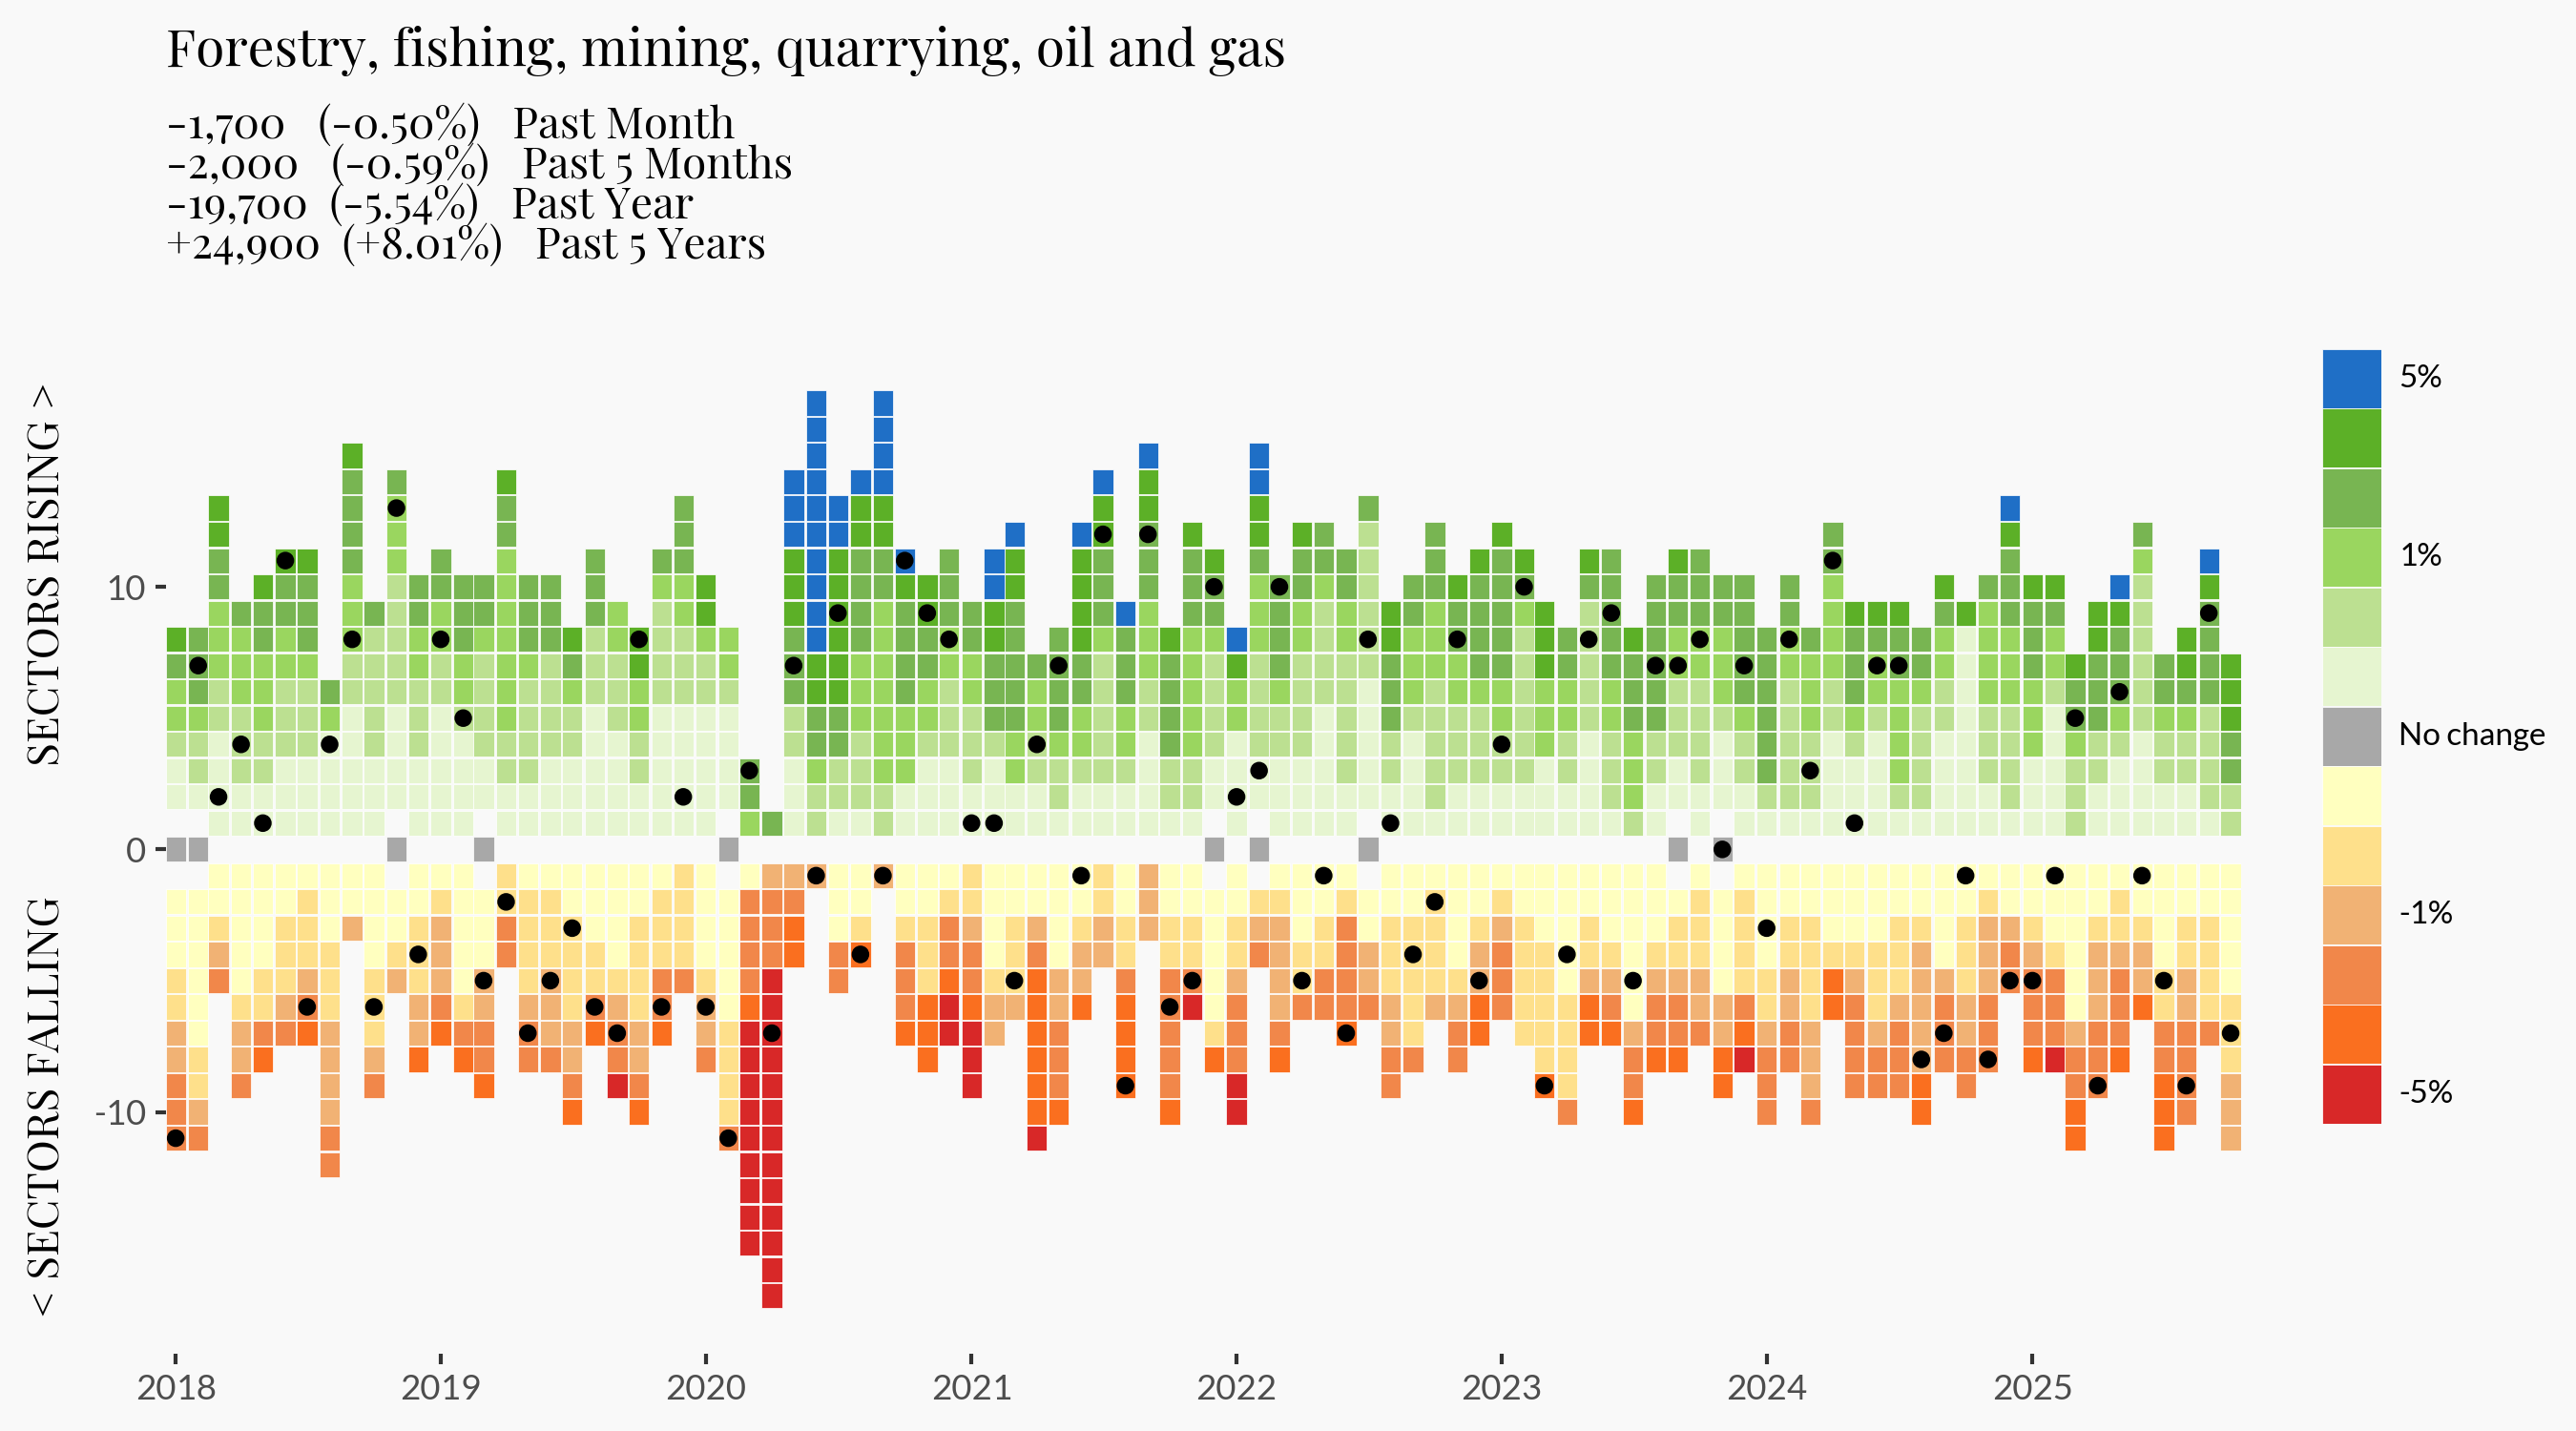
It is on that wonderful background that we get to see the performance of each sector. What could have been ordinary scatter plots (or maybe line graphs) becomes a visualisation experience when wrapped in an interface that invites interaction. This is what we got.
The judges said:
I like the cross-industry comparisons that can be made by toggling through the charts. It feels like small multiples (faceting) could have been a way to tackle this — but probably the charts wouldn’t have been able to capture as much detail.
Nice interactivity.
Great accompanying tutorial and website explaining all the components of the figure.
Runners Up
Recreating YouGov Visualisations
By Jack Davison – Website, GitHub, Bluesky, LinkedIn


The motivation behind Jack’s submission is a timeless human impulse: the desire to imitate what we admire or what simply catches our attention. Through such attempts, we pay tribute but also explore the boundaries of our own ability and that of our tools. This is the story of last year’s winner, of last year’s submission by our judge Jeroen (he wasn’t a judge then), and it is now on plotnine’s front page. It is also the story of plotnine itself.
Davison’s submission was a recreation of well-styled visualisations that capture the mood of the public about political actors. He struggled with plotnine, but the results were great, and the judges had this to say:
These look publication-ready!
Lines, font, and colors are all very crisp. Great accompanying post for the figures. Well executed series of figures.
The Geometry Chronicles: A Tale of 3 Animated Stories
By Jaspreet Pabla – Website
We thought we were holding a visualisation contest; Pabla arrived with an art exhibition, and we are fortunate that his imagination was generous enough to include us.
His core submission was the above three generative-art animations, but buried in the code, we got more of a taste of his fancy with these other animations.
Honorable Mentions
Circle of Fifths
By Manish Datt – GitHub, Website, bluesky, twitter

The judges had this to say:
I’m a sucker for music viz — the fact that this one takes on a useful musical chart, but not typical ‘data science’, got my attention! The out-of-the-box thinking is a cool demonstration of how creative folks can get all kinds of things done with plotnine (and other gg tools).
Good use of applying a domain-specific visualization.
Truchet Tiles
By Deepali Kank – LinkedIn, GitHub, Website, bluesky, twitter


I did not know what Truchet Tiles were. Now I do. The judges were expressive as well:
These artful plots are really nice to look at! Would love to have them as prints!
Really cool way of creating artwork.
Powerwash
By Meghan Harris – LinkedIn, GitHub, Bluesky, Mastodon
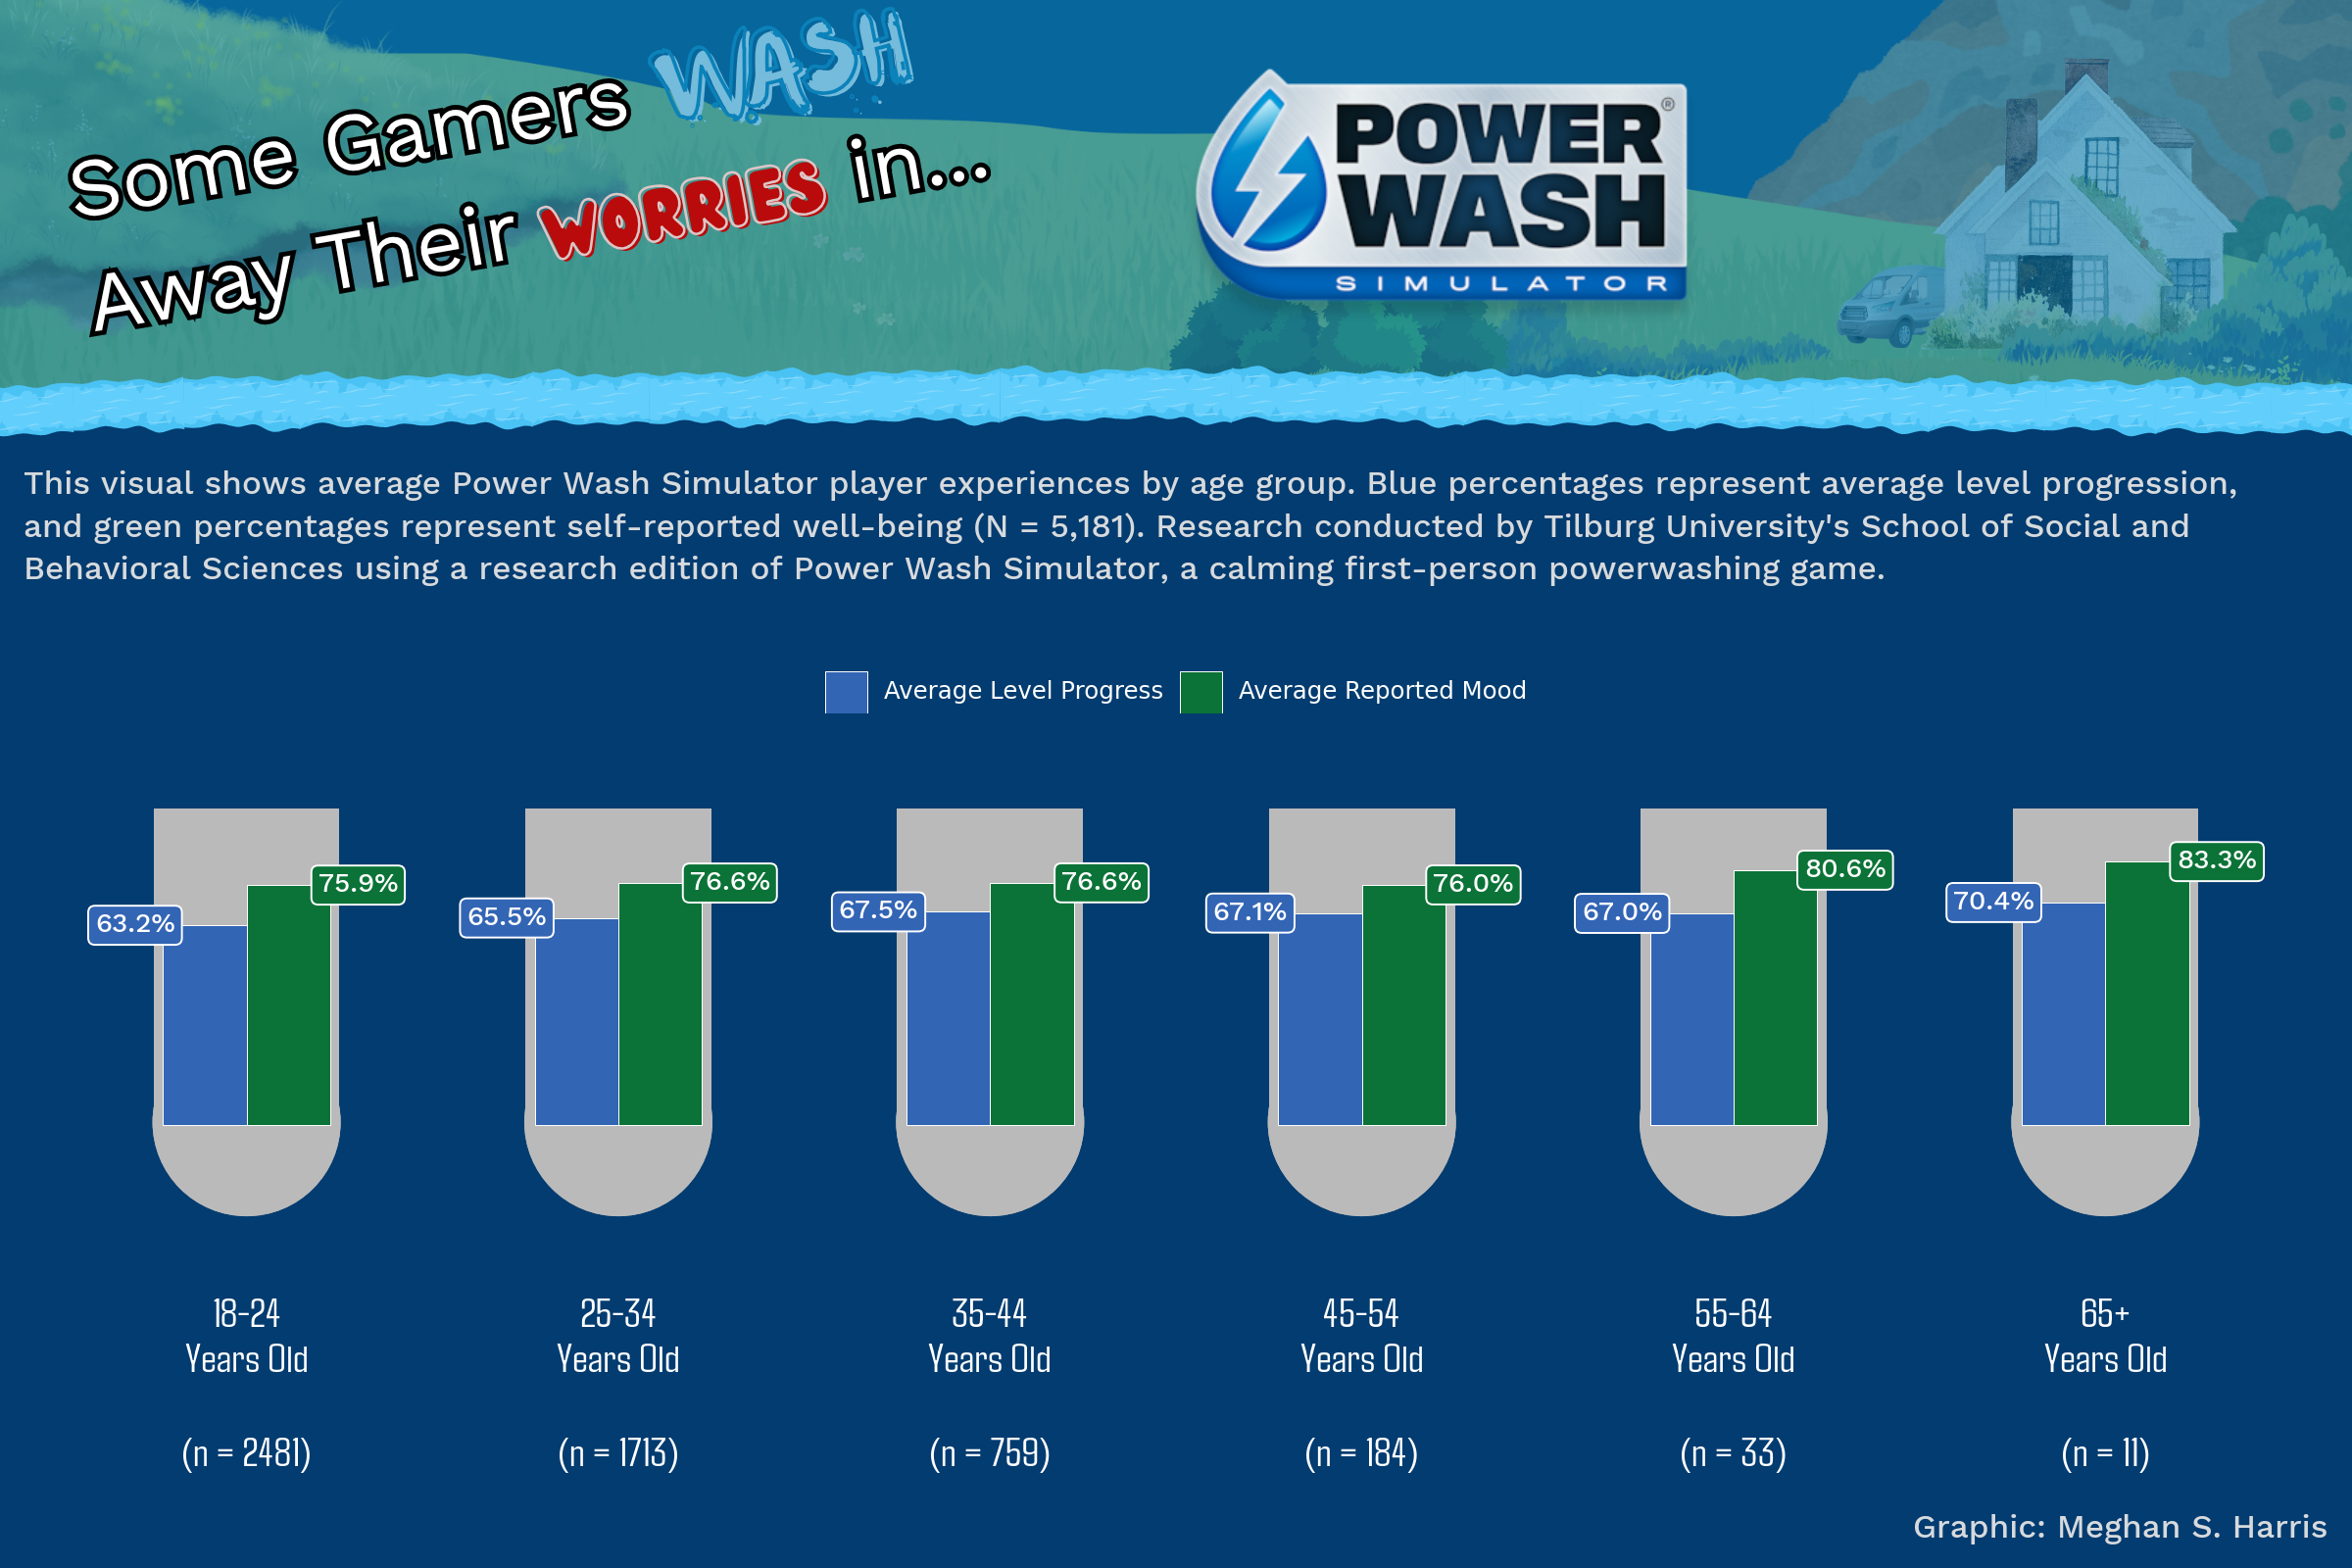
The judges were in for the ride and desired more destinations:
I hadn’t heard of the Power Wash game — but now I’m curious! I know that there’s a lot of thoughtfulness that must have produced such an inviting and memorable chart-exploration experience! Really fun way to visualize game data and bring elements of the actual game into the visualization.
Loanwords & Europe on Holiday
By Muhammad Nakhaee – GitHub, LinkedIn, Website
Muhammad had two separate submissions that are worth highlighting.

One judge ate this up, and they are still hungry:
I love a language-focused chart! I feel like I could pore over this loan-word chart for a while and learn a bunch. Composition is aesthetically pleasing. I may print it out.
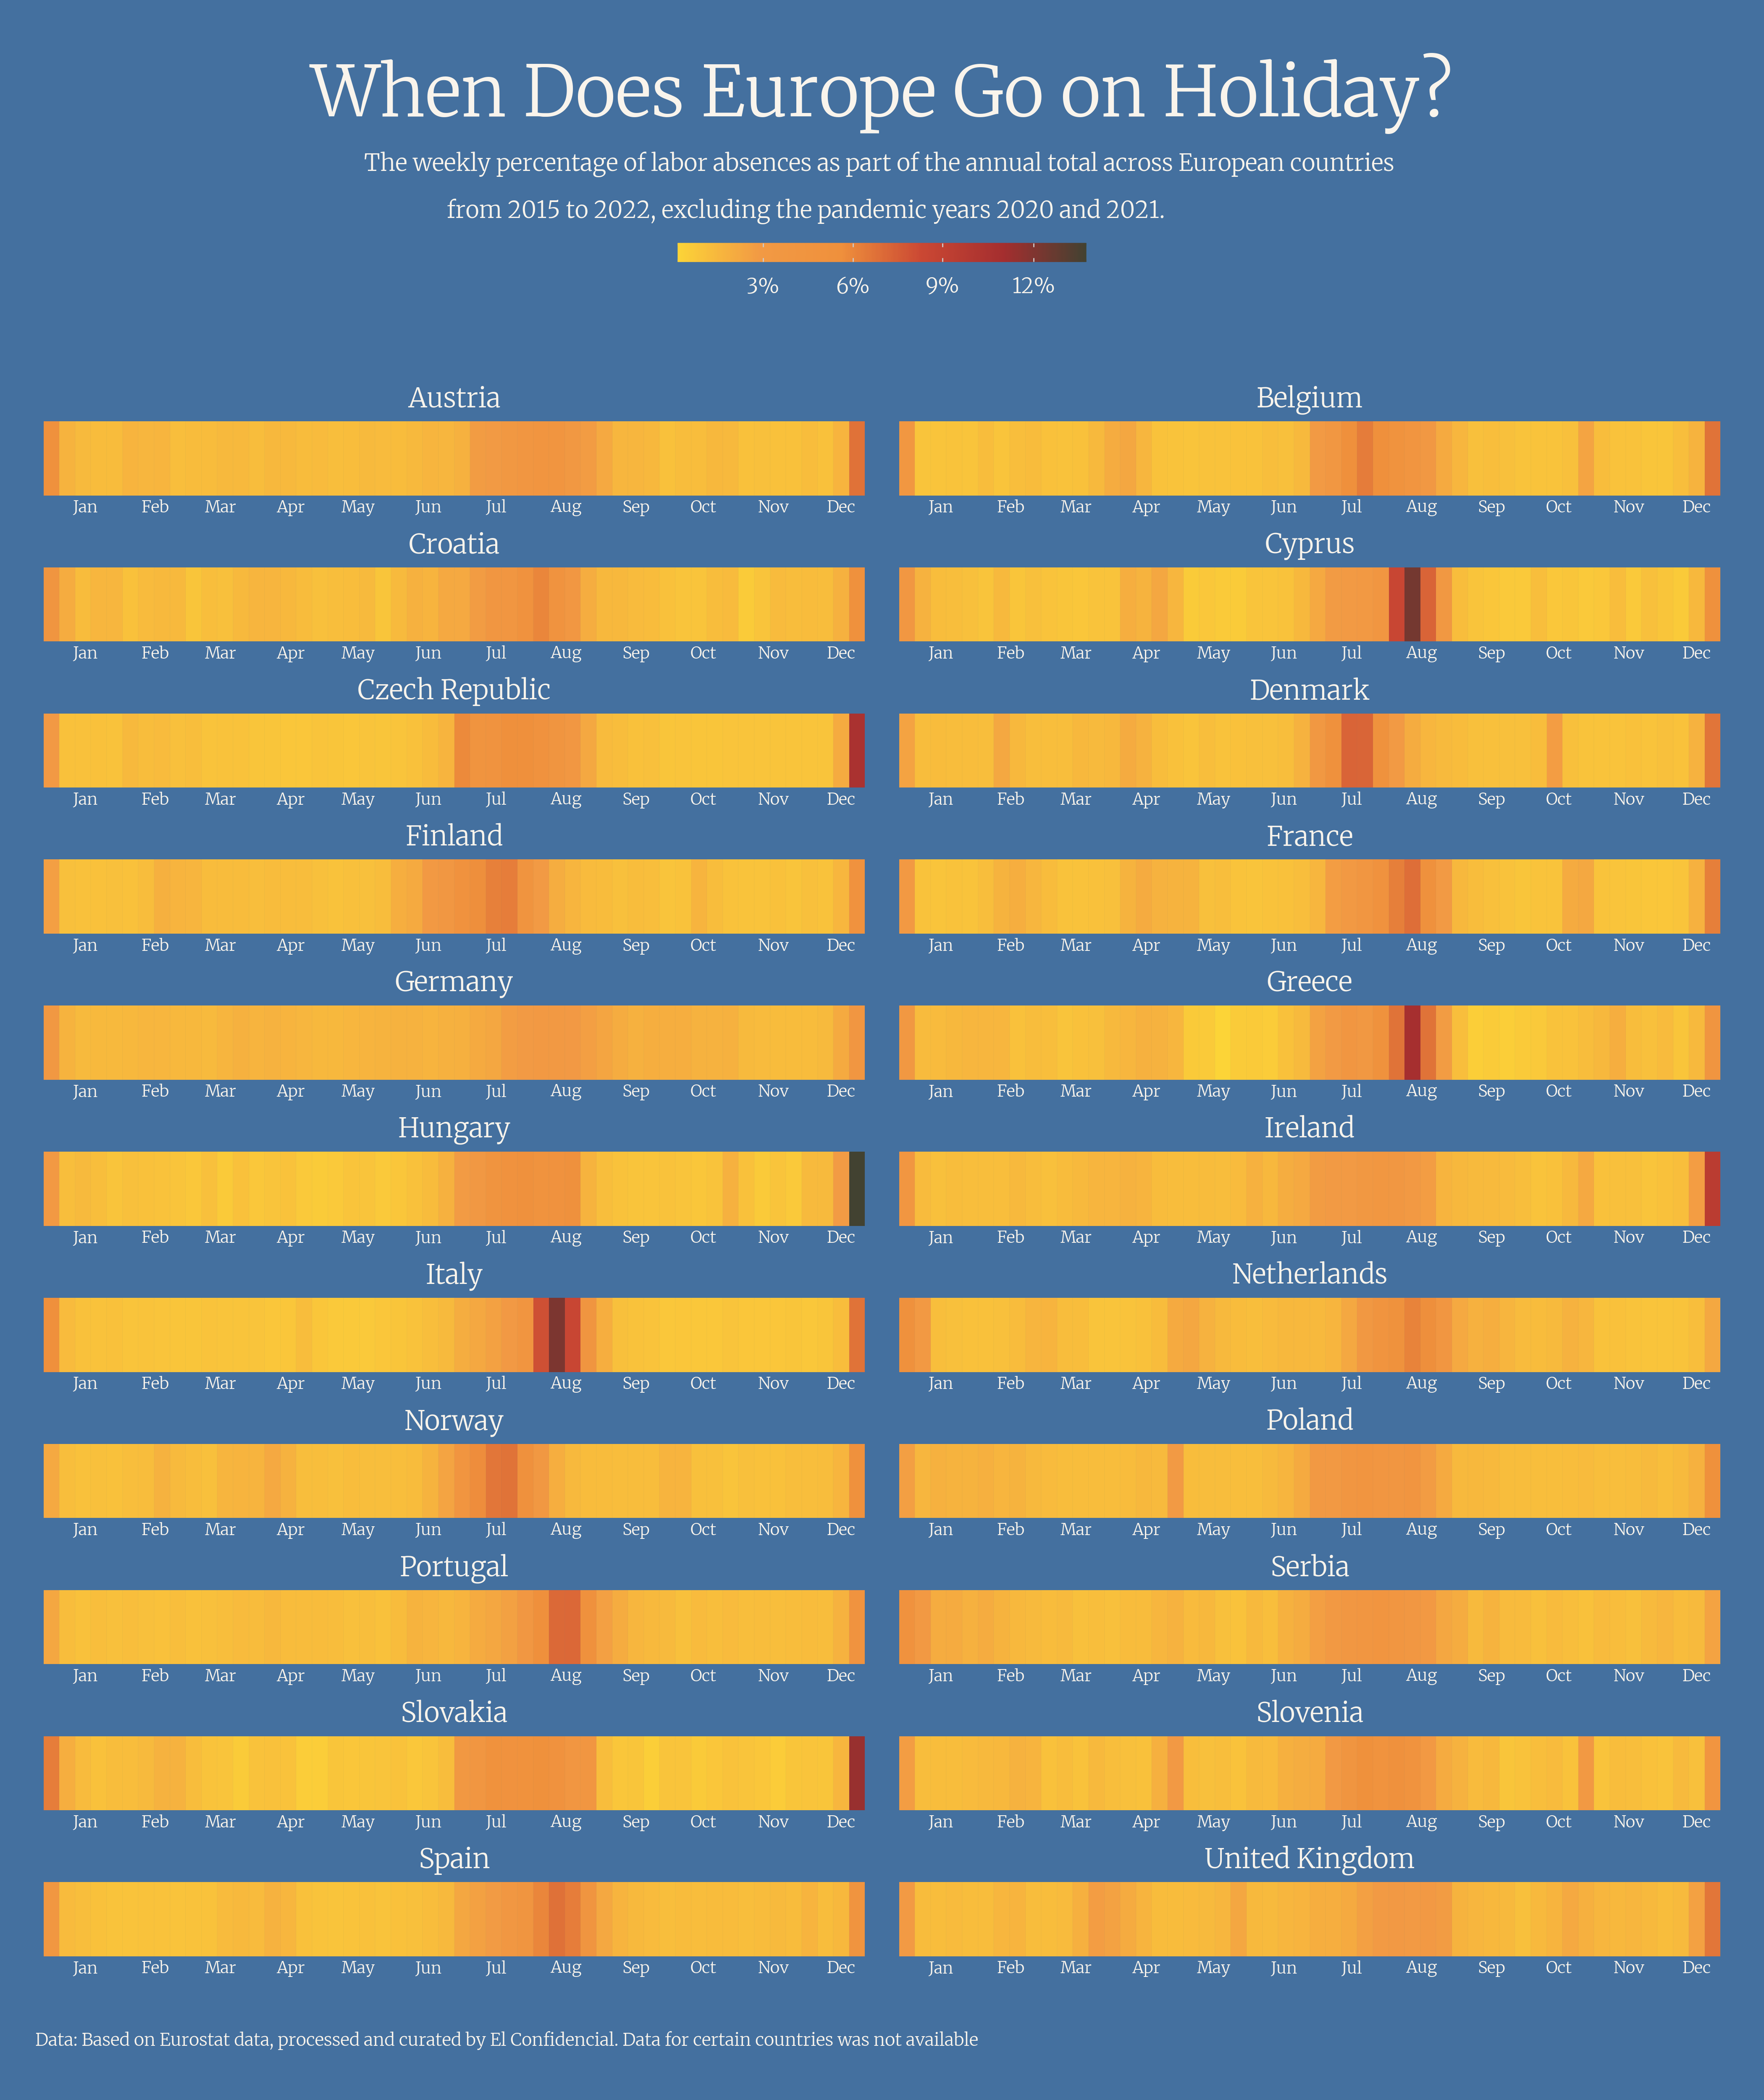
Oh these judges, one of them shrunk themselves to fit into the graphic:
This who’s-vacationing-when chart is simple and effective. It lets you find yourself (your country) with a quick scan and gives you a sense of how you fit into what’s happening elsewhere. I like that.
Great use of theme elements to refine the figure.
Reciprocal Tariffs
By Jerry Wu – GitHub, LinkedIn
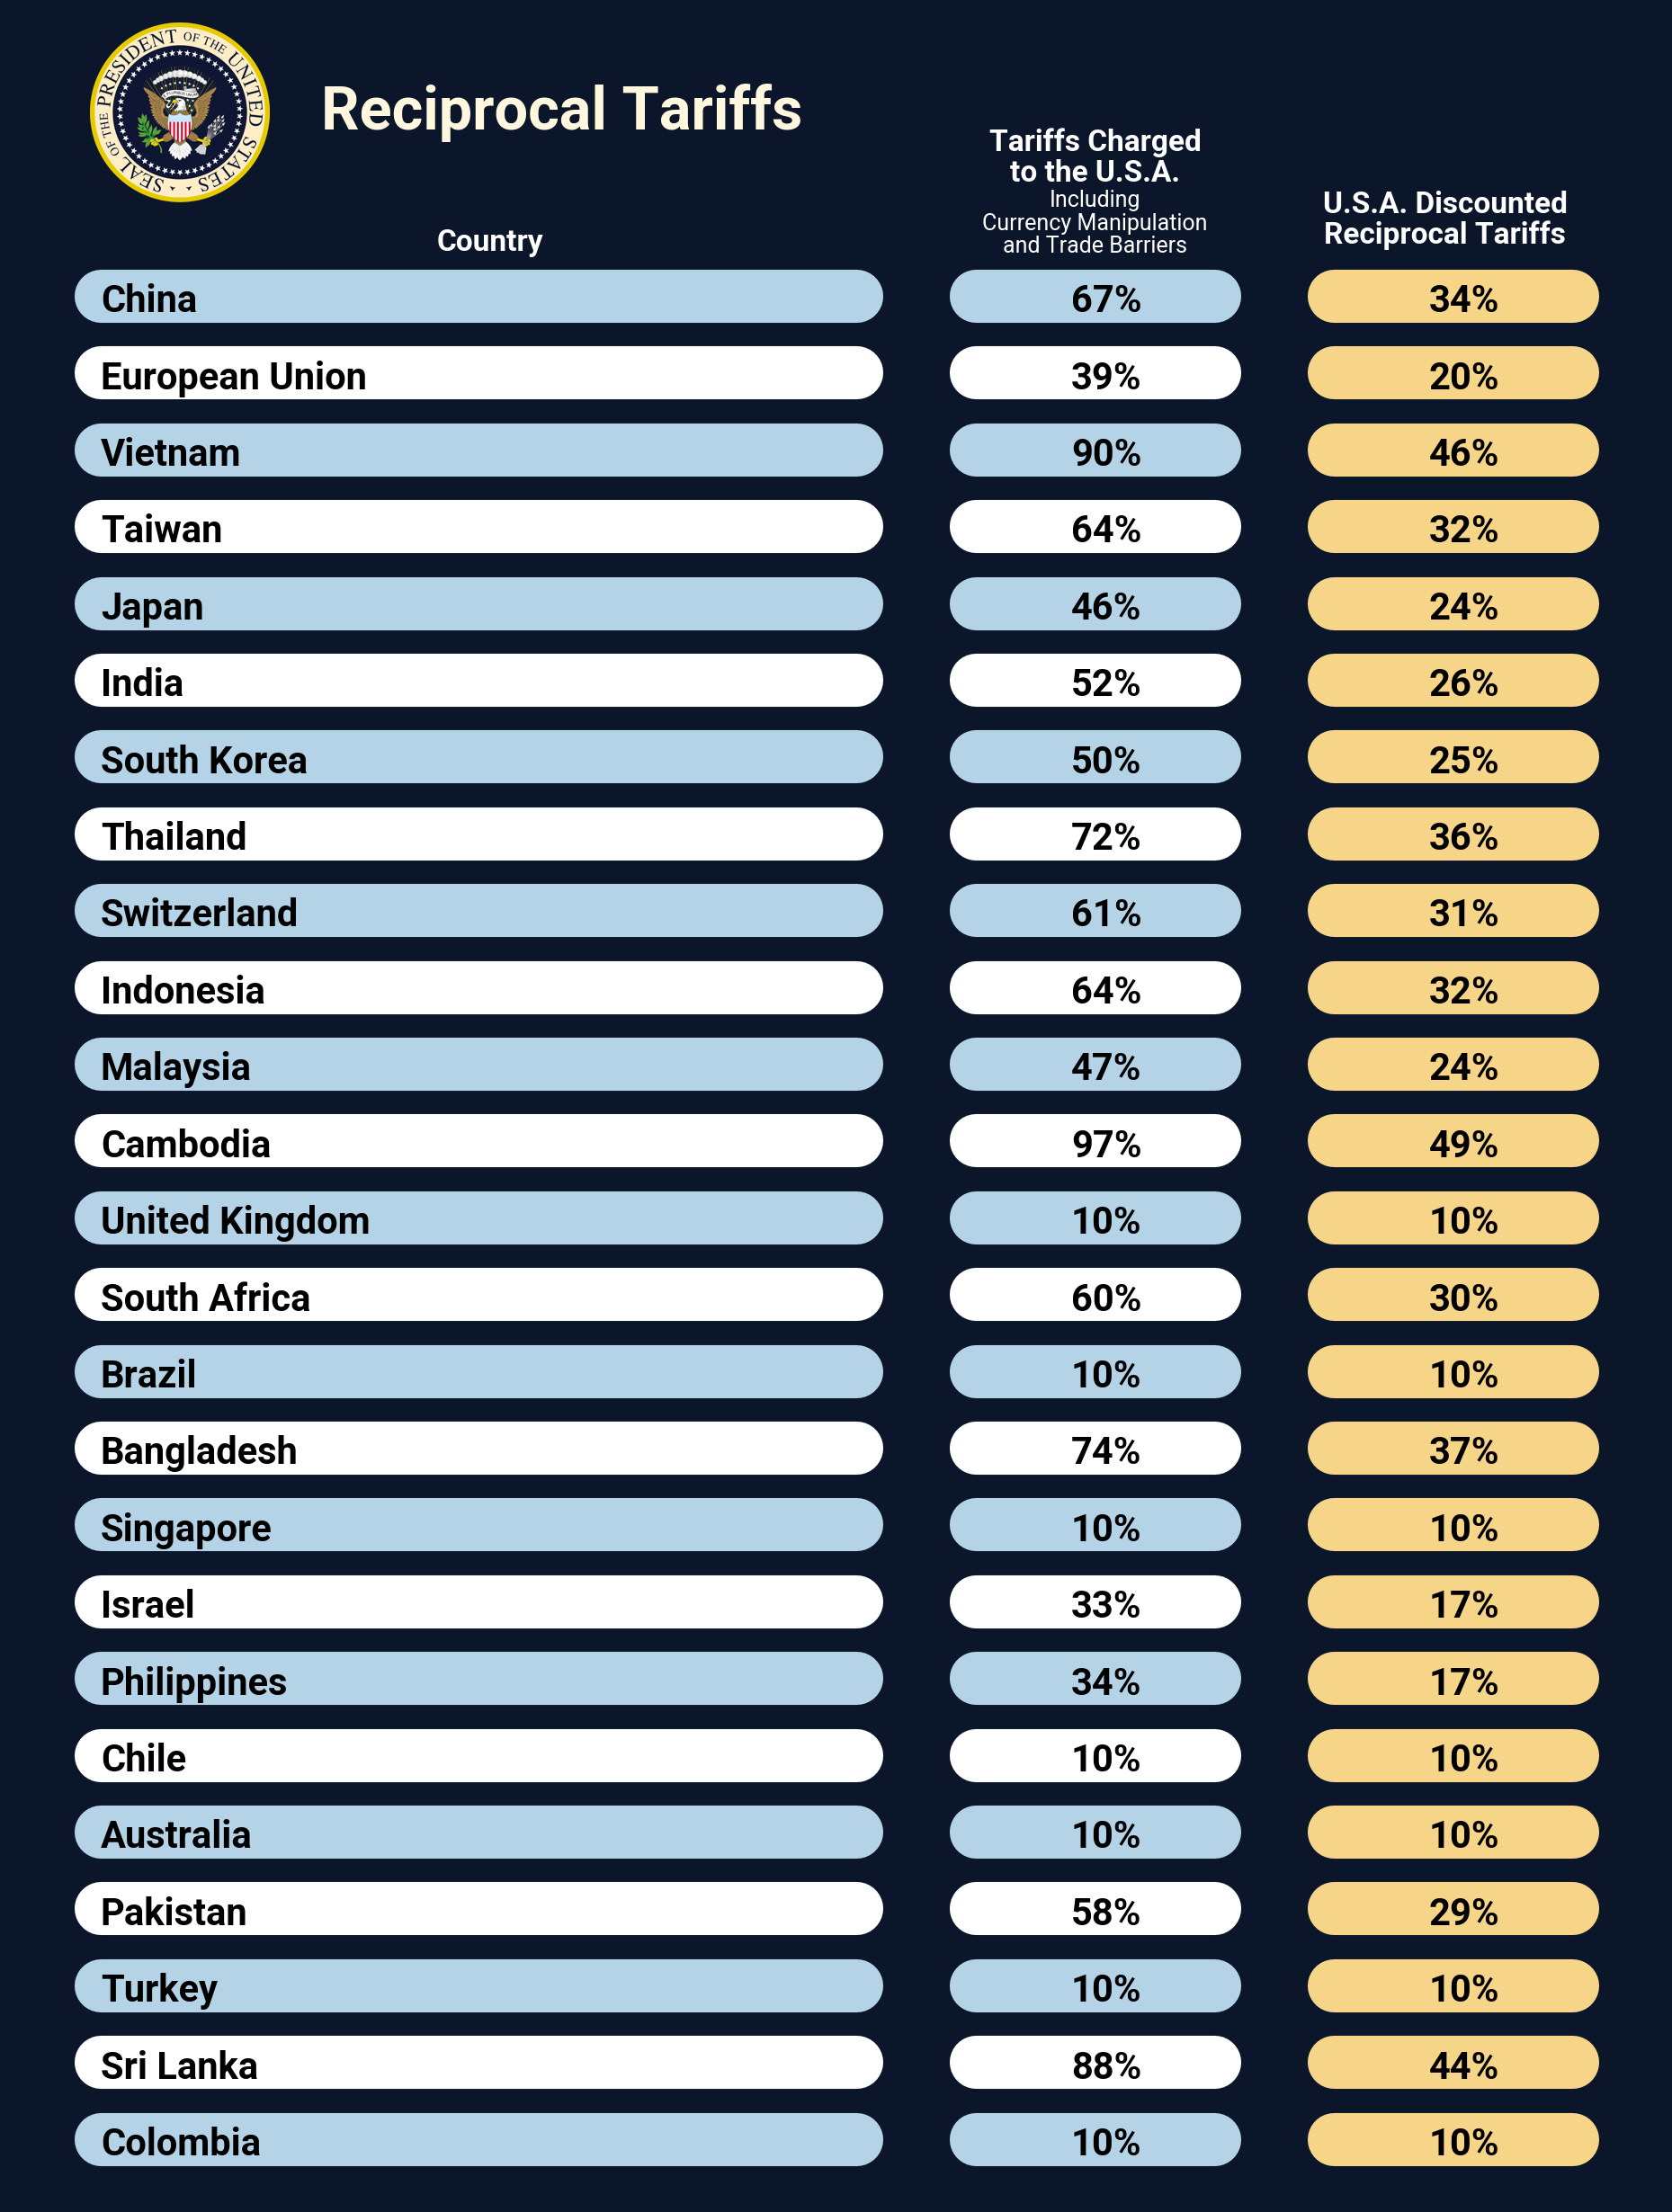
One judge was impressed by the turn of tables:
Table-turned-engaging-info-graphic! This work brings attention to the value of sprucing up tables to be visually engaging.
Vehicle History Overview
By Sam Wilson – GitHub, LinkedIn
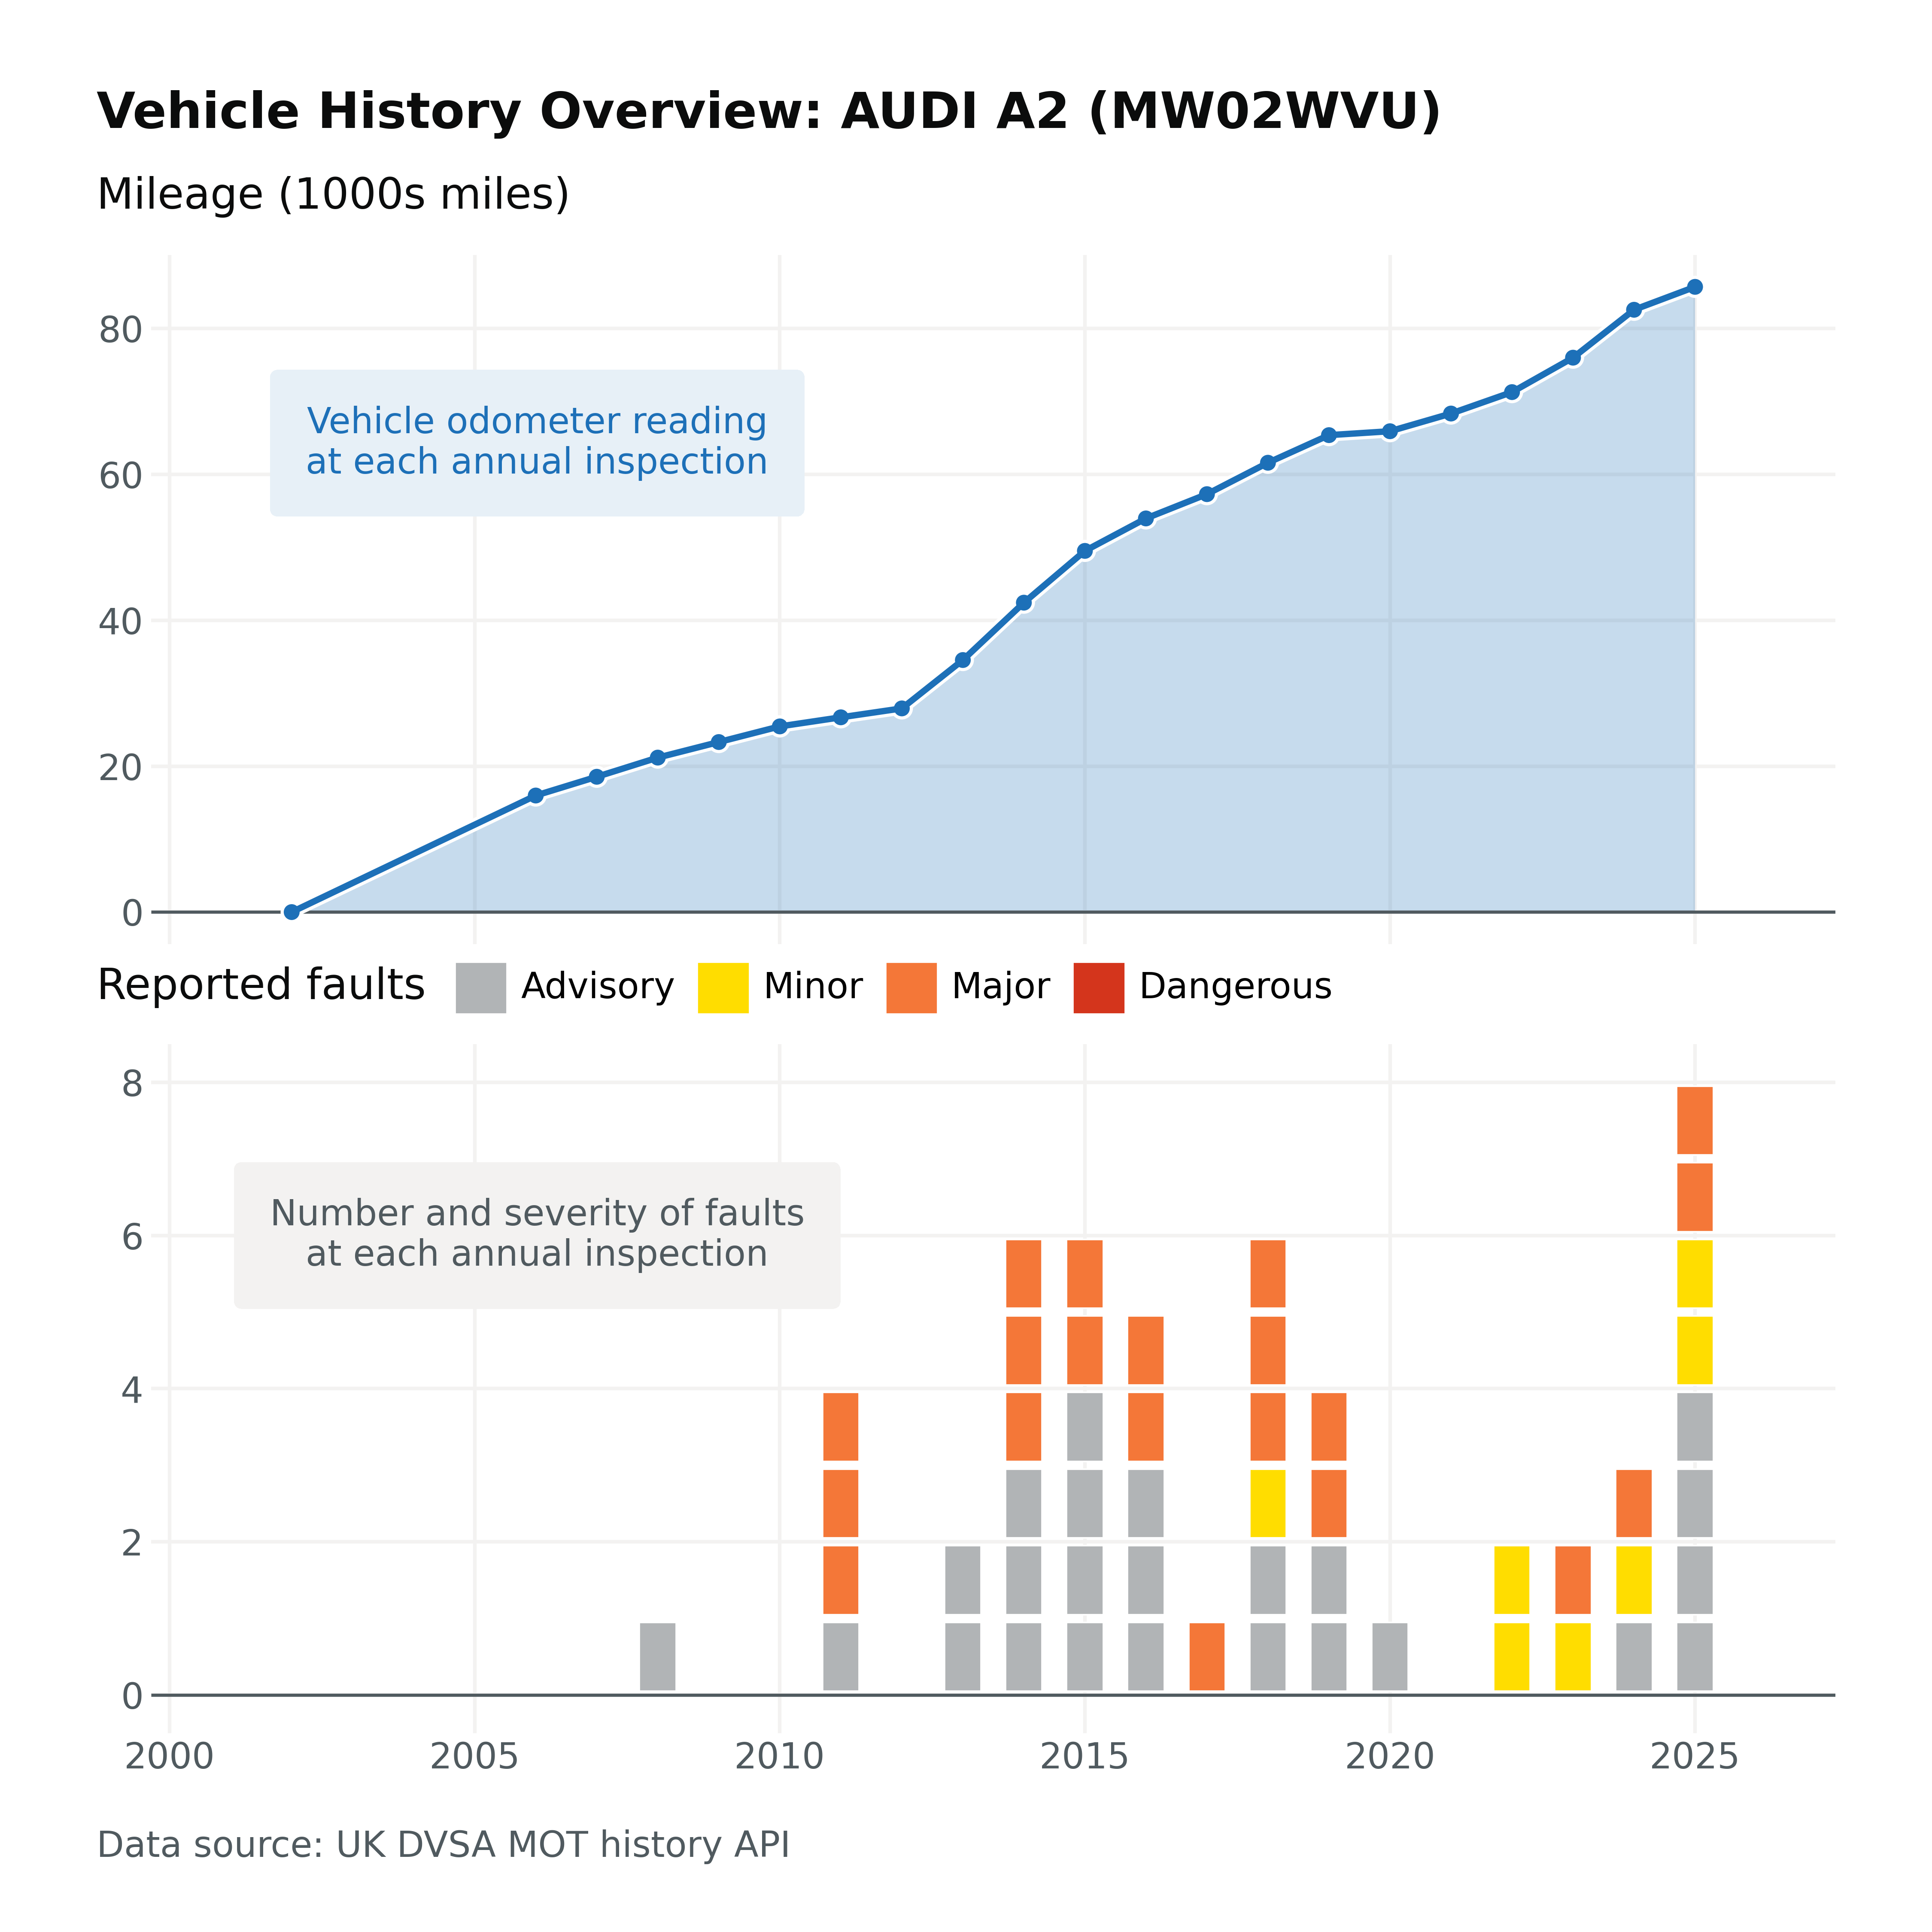
Sam created a Streamlit app that can create visualisations for different cars.
The judges had this to say:
These plots are delightfully clean and do a great job using titles to communicate what the takeaways should be. It’s cool that the plots are specified with the intent to feed in data from different cars.
R-Project Commit Activity Over Time
By Novica Nakov – Bluesky

Novica’s submission reminds us that most visualisations we create are simple, but we can make them stand out. And one judge liked the dataset visualised that way:
Really fun way to get and visualize this data on commits per release.
Thank you
Judging contests is not an objective activity. The difference between the winning submission(s) and the rest is often subtle, and it is shaped as much by the tastes of the judges as by any measurable metric. As a result, the final selection reflects a combination of technical merit, creativity, clarity, and the subjective lens through which the panel views the work — rather than a single definitive standard of quality.
I am grateful to all the contestants, for this contest gives me a type of feedback that is not easy to come by. When your imagination competes with what the library can do, you often brush against rough edges that can and should be smoothed. I look out for these in every single submission: in the code by examining the choices you make, and in the commentaries where you are explicit about the limitations. This is valuable, and thank you.
In this post, “I” is the voice of Hassan Kibirige, and “we” is the voice that includes the co-organisers, including Michael Chow (who also helps with other plotnine-related matters). We are all grateful, and we say thank you.
Footnotes
On the night of June 21, 1932, Joe Jacobs, a professional prize fight manager, after hearing that his man had not been awarded the decision, achieved for himself linguistic immortality by shouting into the right announcer’s microphone, “We was robbed!”
Quinn, Arthur (1982). Figures of Speech: 60 ways to turn a phrase. p. 5.↩︎
Related Content

Don't bring a spreadsheet to a data fight

Snowflake Native Apps vs. Connected Apps for financial services
